

Penerangan
**Vmm Signal Trend Pro - Penunjuk untuk cTrader**
**Penerangan Umum**
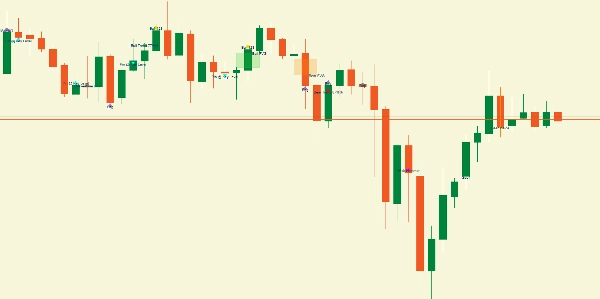
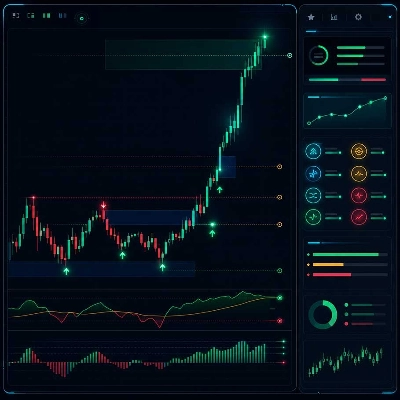
Vmm Signal Trend Pro adalah penunjuk analisis teknikal canggih untuk platform cTrader yang mengesan pelbagai corak harga secara masa nyata. Ia menggabungkan pengesanan tren, corak lilin, FVG (Fair Value Gaps), jurang, dan corak penting lain ke dalam satu penunjuk visual.
**Ciri-ciri Utama**
**1. Pengesanan Tren**
- **Analisis Tindakan Harga**: Mengenal pasti tren melalui tindakan harga sepanjang N lilin terakhir
- **Kekuatan Tren**: Mengira peratusan kekuatan berdasarkan momentum dan struktur
- **Ikon Arah**: Anak panah hijau (naik) atau anak panah merah (turun) apabila tren kuat
**2. Corak Dikesan**
**Fair Value Gap (FVG)**
- **FVG Bullish**: Apabila rendah semasa > tinggi 2 lilin lalu
- **FVG Bearish**: Apabila tinggi semasa < rendah 2 lilin lalu
- **Kawasan Berwarna**: Segi empat tepat separa telus (hijau/oren)
**Jurang**
- **Jurang Naik**: Pembukaan di atas tinggi sebelumnya
- **Jurang Turun**: Pembukaan di bawah rendah sebelumnya
- **Visualisasi**: Segi empat kecil di pembukaan lilin
**Inside Bars**
- Lilin sepenuhnya dalam julat lilin sebelumnya
- Perbezaan warna (kuning/oren) berdasarkan arah
**Corak 123 (Songsang)**
- **Corak 123 Bullish**: Tiga titik dengan pecahan ke atas
- **Corak 123 Bearish**: Tiga titik dengan pecahan ke bawah
- **Isyarat**: Ikon bulat Emas
**Corak Wick**
- **Seperti Hammer**: Wick bawah yang ketara
- **Seperti Shooting Star**: Wick atas yang ketara
- **Ikon**: Bintang Magenta
**Pin Bars**
- Wick panjang (≥2x badan) dengan badan kecil
- Pengesanan tahap utama berdekatan
- **Ikon**: Segitiga Naik/Turun (sian)
**Engulfing**
- **Engulfing Bullish**: Lilin bullish menelan lilin bearish sebelumnya
- **Engulfing Bearish**: Lilin bearish menelan lilin bullish sebelumnya
- **Ikon**: Berlian Ungu
**Doji**
- Badan sangat kecil (≤10% julat total secara lalai)
- Jenis khas: Gravestone, Dragonfly, Long-Legged
- **Ikon**: Bulatan Kelabu
**3.** Sistem Sokongan/Perlawanan**
- Pengesanan automatik tinggi/rendah ayunan
- Mengambil kira kedekatan dengan tahap utama untuk meningkatkan kepentingan
**4. Penapisan Pintar**
- **Had Mengikut Jenis**: Bilangan maksimum isyarat setiap kategori
- **Jarak Masa**: Mengelakkan isyarat yang terlalu rapat
- **Penapis Tren**: Pilihan untuk membenarkan/menolak isyarat lawan tren
- **Kekuatan Minimum**: Menapis isyarat lemah
**Parameter Boleh Disesuaikan**
**Asas**
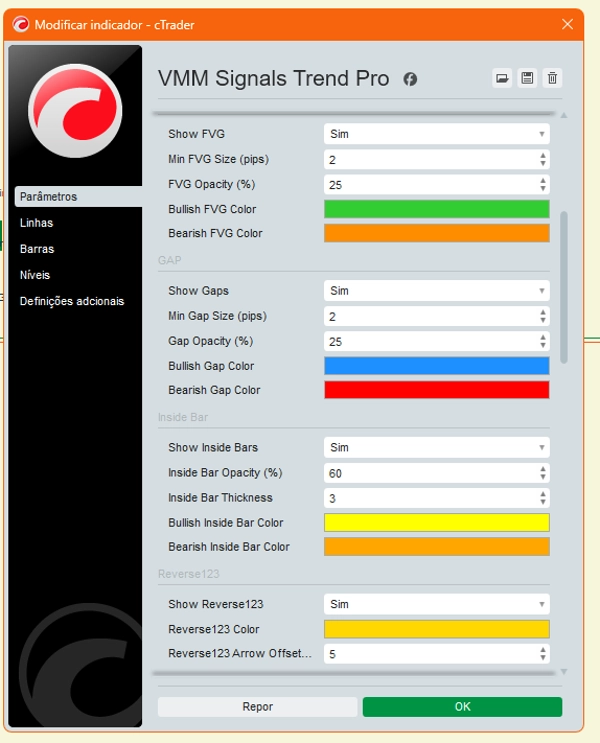
- `Tunjukkan Arah Tren`: Mengaktifkan anak panah tren
- `Semak Lilin Sebelumnya`: Bilangan lilin untuk analisis
- `Ambang Kekuatan Tren`: Peratus minimum untuk menganggap tren kuat
**FVG**
- `Saiz Min FVG`: Saiz minimum dalam pips
- `Ketelusan`: Ketelusan kawasan
- `Warna`: Warna boleh disesuaikan
**Jurang**
- `Saiz Min Jurang`: Saiz minimum dalam pips
- `Warna`: Warna untuk jurang naik/turun
**Inside Bars**
- `Ketebalan`: Ketebalan garis
- Ketelusan: Ketelusan
- Warna: Warna berbeza mengikut arah
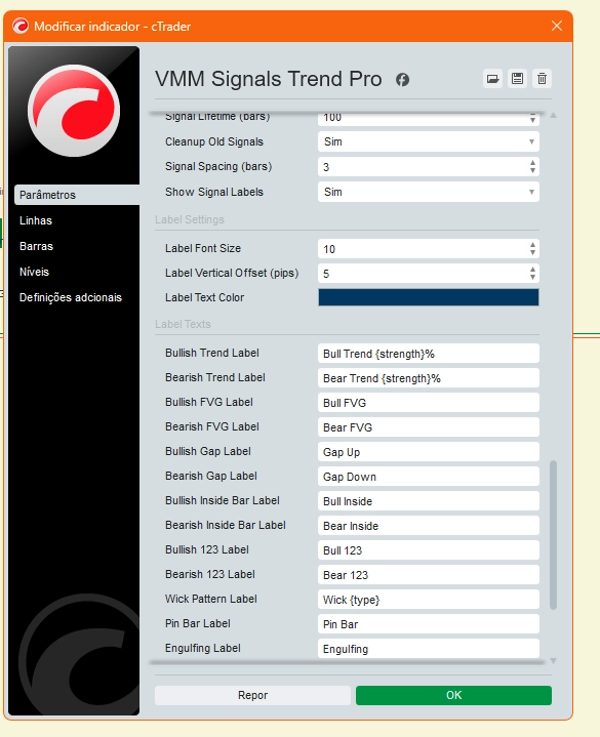
Isyarat:
- Jangka Hayat Isyarat: Tempoh isyarat (dalam lilin)
- Jarak Isyarat: Jarak minimum antara isyarat
- Maksimum Isyarat Setiap Jenis: Had per kategori
Label Tersuai:
- Teks Boleh Disesuaikan: Setiap corak mempunyai teks yang boleh dikonfigurasikan sendiri
- Pemegang Tempat: `{strength}` untuk % kekuatan, `{type}` untuk jenis tertentu
- Format: Saiz fon, offset menegak, warna
- Mod Pendek: Label ringkas untuk carta padat
Mekanisme Dalaman:
1. Analisis Tren:
- Regresi Linear: Mengira cerun tren
- Kiraan Lilin: Bullish vs. Bearish sepanjang N tempoh terakhir
- Momentum: Mengambil kira magnitud pergerakan
2. Pengurusan Objek**
- **Cache Objek**: Mengelakkan melukis semula isyarat sedia ada
- **Pembersihan Automatik**: Mengeluarkan isyarat lama berdasarkan jangka hayat
- **Kaunter Mengikut Jenis**: Mengawal kuantiti maksimum
**3. **Pengiraan Kekuatan**
- Setiap corak mempunyai formula kekuatan khusus
- Berdasarkan nisbah, jarak pip, kedekatan dengan tahap utama
- Julat: 0-100%
**Visualisasi Carta**
**Elemen Carta**
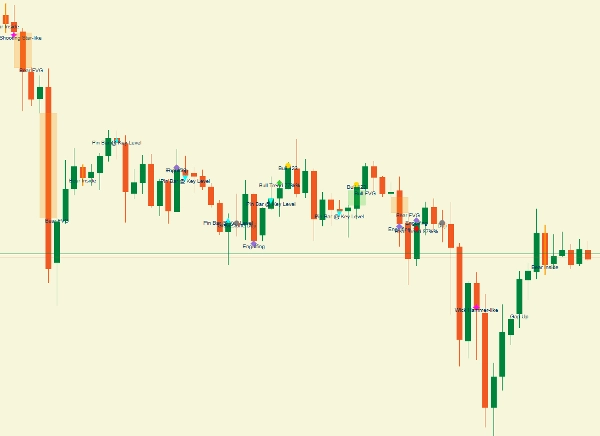
1. **Ikon**: Anak panah, segitiga, bulatan, berlian, bintang
2. **Kawasan**: Segi empat tepat separa telus (FVG/Jurang)
3. **Garis**: Inside bars yang diserlahkan
4. **Label**: Teks informatif di sebelah isyarat
**Kod Warna**
- **Hijau**: Bullish (tren, FVG, jurang)
- **Merah/Orens**: Bearish (tren, FVG, jurang)
- **Kuning/Orens**: Inside bars (bullish/bearish)
- **Emas**: Corak 123
- **Magenta**: Corak Wick
- **Sian**: Pin bars
- **Ungu**: Engulfing
- **Kelabu**: Doji
**Kelebihan**
**Untuk Pedagang**
- **Semua dalam satu**: Pelbagai corak dalam satu penunjuk
- **Boleh disesuaikan**: Penalaan halus setiap corak
- **Visual jelas**: Kod warna intuitif
- **Penapisan**: Mengelakkan beban isyarat
**Kes Penggunaan**
**1. Analisis Pantas**
- Kenal pasti tren yang sedang berlaku
- Semak FVG dan jurang terkini
- Mengesan corak pembalikan
**2. Pengesahan Masuk**
- Gabungkan pelbagai corak untuk meningkatkan kebarangkalian
- Semak penjajaran dengan tren
- Pertimbangkan kekuatan isyarat
**3. Pengurusan Risiko**
- Kenal pasti tahap sokongan/perlawanan berdekatan
- Gunakan FVG sebagai kawasan minat
- Pertimbangkan jarak isyarat
**Keterbatasan**
**Kebergantungan**
- **Pasaran tidak stabil**: Mungkin menghasilkan banyak isyarat
- **Jangka masa**: Tetapan mungkin perlu disesuaikan mengikut jangka masa
- **Aset**: Tingkah laku berbeza mengikut pasangan mata wang
**Pertimbangan**
- **Bukan ramalan**: Corak lalu ≠ jaminan masa depan
- **Pengesahan diperlukan**: Sentiasa sahkan dengan analisis tambahan
- **Isyarat palsu**: Penapis mengurangkan tetapi tidak menghapuskan
**Cadangan Penggunaan**
**Tetapan Awal**
1. Mulakan dengan `Penapisan Pintar = true`
2. Laraskan `Kekuatan Isyarat Min` mengikut gaya anda
3. Gunakan `Jarak Isyarat` untuk mengelakkan beban
4. Sesuaikan warna untuk visualisasi lebih baik
**Gabungan Berkesan**
- **Tren + FVG**: Penjajaran Kuat
- **Inside bar + Tahap utama**: Kawasan masuk baik
- **Pin bar + Engulfing**: Pengesahan pembalikan
- **123 + Tren**: Kemungkinan sambungan
**Pemantauan**
- Semak log di konsol secara berkala
- Laraskan parameter mengikut pasaran
- Gunakan bersama penunjuk lain
Penunjuk ini adalah alat lengkap untuk pedagang yang mencari analisis teknikal menyeluruh yang memfokuskan pada tindakan harga dan corak visual, menawarkan fleksibiliti penuh dalam menyesuaikan dan menapis isyarat.
**⚠️ PENAFIAN PENTING**
Penunjuk ini adalah ALAT ANALISIS TEKNIKAL. Isyarat yang dijana adalah CADANGAN berdasarkan algoritma, BUKAN cadangan pelaburan. Perdagangan melibatkan risiko kerugian yang ketara. Prestasi lalu tidak menjamin keputusan masa depan. Pedagang menanggung SEPENUHNYA TANGGUNGJAWAB untuk semua keputusan perdagangan. Sentiasa gunakan pengurusan risiko yang betul dan uji pada akaun demo sebelum berdagang secara langsung.
Ringkasan
Ulasan pelanggan
Perbincangan
Soalan Lazim
Lebih banyak produk daripada penulis ini

















Harga