Penerangan
Sistem ADX Awan & Momentum Lanjutan
Indeks Arah Purata (ADX) standard adalah alat yang kuat, tetapi jujur saja: menatap tiga garis yang bersilang (+DI, -DI, dan ADX) adalah kekacauan, mengelirukan, dan membebankan mata anda.
Penunjuk Lanjutan ADX sepenuhnya memodenkan alat klasik ini. Ia mengubah garis yang kacau menjadi kuasa visual yang jelas yang memberitahu anda dengan tepat SIAPA yang mengawal (Lembu vs. Beruang) dan BETAPA KUAT tren itu, semuanya dalam satu pandangan.
Ciri Utama
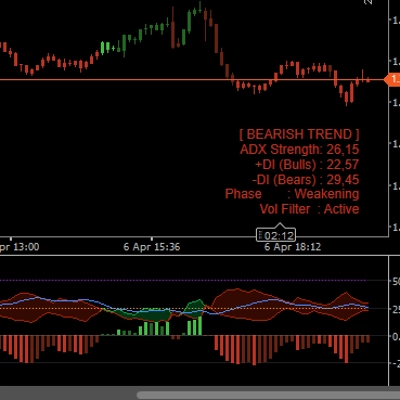
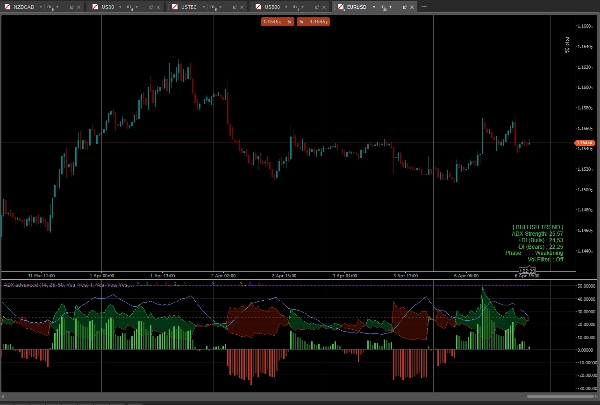
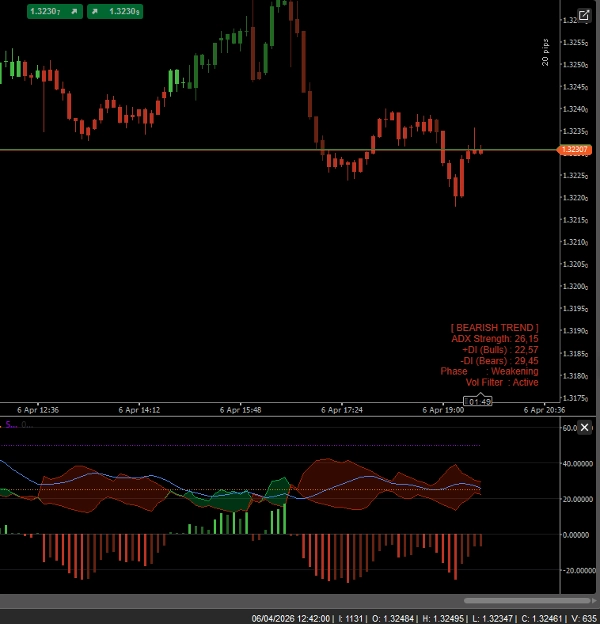
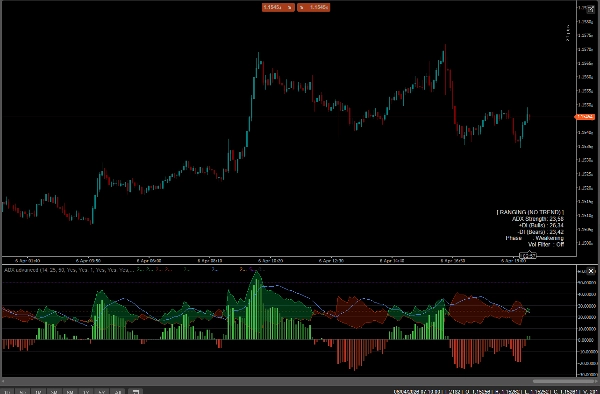
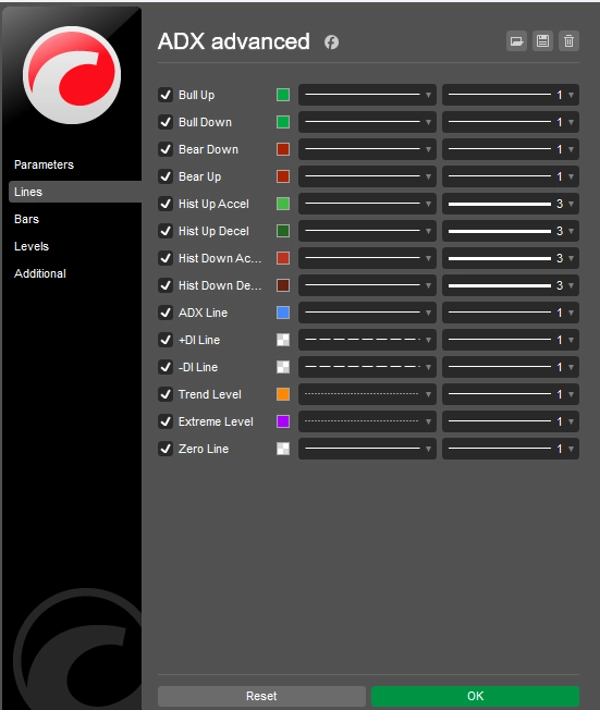
- Awan Arah (Awan DI): Sebaliknya daripada garis yang bersilang, ruang antara +DI dan -DI diisi dengan awan warna dinamik. Awan Hijau = Lembu mengawal. Awan Merah = Beruang mengawal.
- Histogram Momentum: Histogram yang dibina khas di bahagian bawah penunjuk mengukur jarak tepat antara +DI dan -DI. Ia menampilkan warna pecutan/pelahan, membolehkan anda mengenal pasti momentum yang pudar sebelum tren benar-benar berbalik.
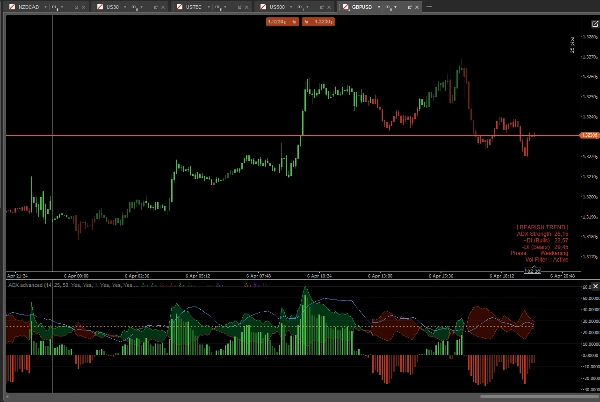
- Pewarnaan Bar Pintar (Paintbars): Penunjuk secara langsung mewarnakan lilin harga anda berdasarkan kekuatan tren!
-
- Hijau/Merah Cerah: Tren Kuat (ADX > 25 & penjajaran +DI/-DI)
- Hijau/Merah Gelap: Tren Lemah / Ranging (ADX < 25)
- Ungu/Magenta: Tren Sangat Melampau (ADX > 50) - Bersedia untuk pembetulan!
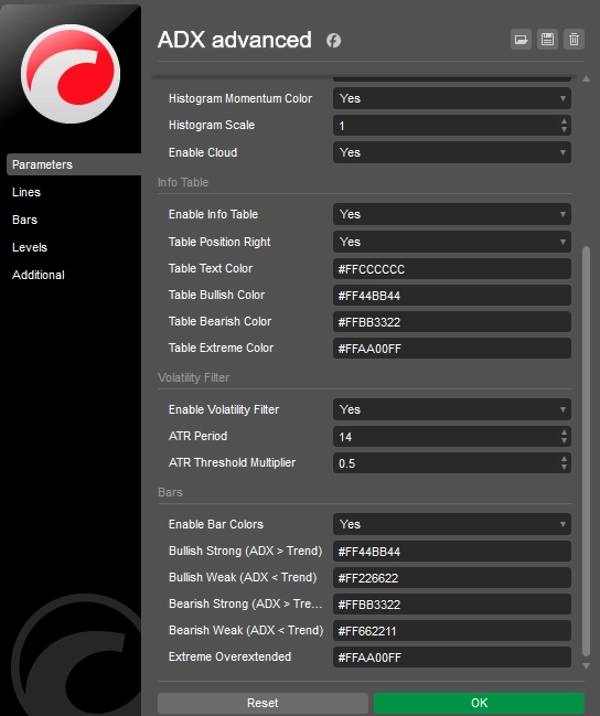
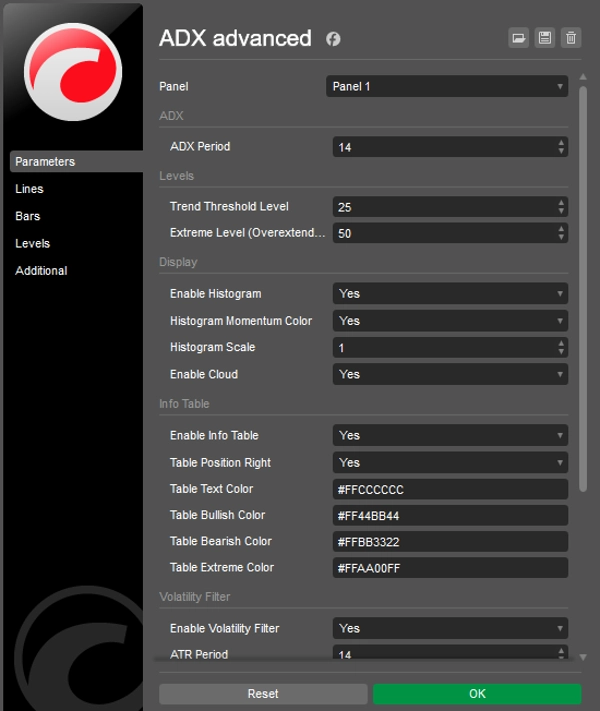
- Panel Maklumat Pada Carta: Papan pemuka yang kemas dan tidak mengganggu memaparkan Keadaan Pasaran semasa (Trending, Ranging, Extreme), Kekuatan ADX, dan Fasa Momentum secara masa nyata.
- Penapis Volatiliti Terbina Dalam (ATR): Penapis ATR pilihan yang mengaburkan lilin dan bar histogram apabila pasaran menjadi benar-benar rata, menyelamatkan anda daripada berdagang dalam keadaan tidak menentu.
- Boleh Disesuaikan Sepenuhnya: Tukar warna, ambang (Tahap Tren 25, Tahap Extreme 50), dan skala histogram untuk menyesuaikan gaya dagangan peribadi dan tema carta anda.
Bagaimana menggunakannya?
- Tunggu garis biru ADX melintasi ambang 25 (Tren aktif).
- Lihat Awan dan Histogram untuk mengesahkan arah (Hijau untuk Long, Merah untuk Short).
- Berdagang pecahan dan ikuti tren selagi lilin diwarnakan dengan warna "Kuat".
- Ambil keuntungan atau jejak hentian apabila garis ADX melintasi Tahap Extreme 50 (lilin bertukar ungu).
Ringkasan
Profil indikator
Ulasan pelanggan
4.3
Ulasan: 3
5 | 33 % | |
4 | 67 % | |
3 | 0 % | |
2 | 0 % | |
1 | 0 % |
Ulasan pelanggan
April 16, 2026
April 12, 2026
Perbincangan
Soalan Lazim
BTCUSD
Forex
Signal
Indices
EURUSD
Commodities
GBPUSD
NZDUSD
Prop
XAUUSD
NAS100
ATR
USDJPY
Produk yang tersedia melalui cTrader Store, termasuk bot dagangan, indikator dan plugin, disediakan oleh pembangun pihak ketiga dan diberikan akses untuk tujuan maklumat dan teknikal sahaja. cTrader Store bukan broker dan tidak memberikan nasihat pelaburan, syor peribadi atau sebarang jaminan prestasi masa hadapan.


Harga
24
Jualan
677
Pemasangan percuma