
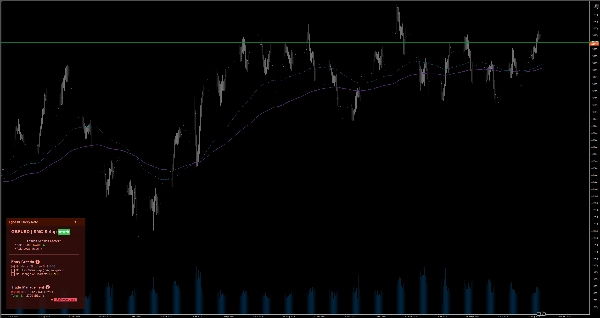

Penerangan
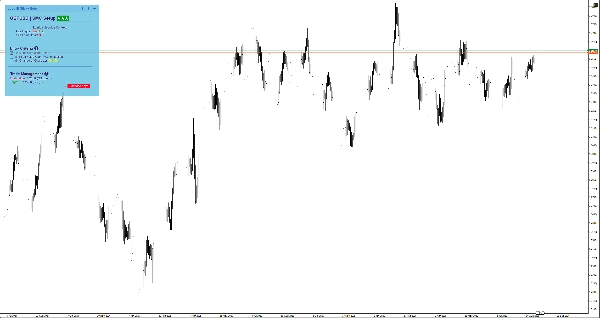
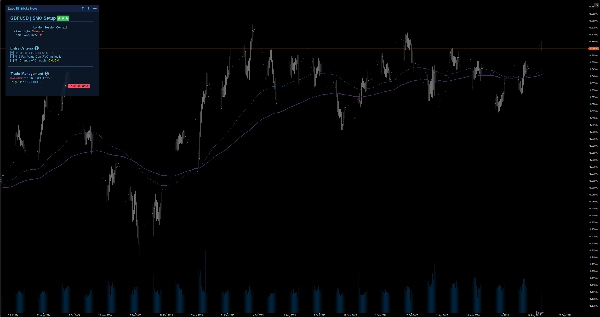
Kekalkan fokus anda dengan nota pintar di carta. Mempunyai Markdown, 6 tema, dan simpan automatik bagi setiap simbol untuk perdagangan manual.
Apabila mengecilkan skala dari carta Bulanan ke carta 1 minit, mudah untuk kehilangan gambaran besar dan membuat perdagangan emosi. EgosHf Sticky Note menyelesaikan ini dengan mengekalkan peraturan, senarai semak, dan bias HTF anda terus dipaparkan pada skrin kerja anda.
🎯 Siapa yang sesuai?
Sesuai untuk pedagang manual, pengamal Price Action/SMC, dan pedagang swing yang bergantung pada disiplin ketat, analisis dari atas ke bawah, dan pelaksanaan langkah demi langkah.
💡 Kes Penggunaan Tipikal
- Analisis Dari Atas ke Bawah: Tulis bias Harian/Mingguan anda sebelum memperbesar ke jangka masa pelaksanaan untuk mengelakkan perangkap lawan trend.
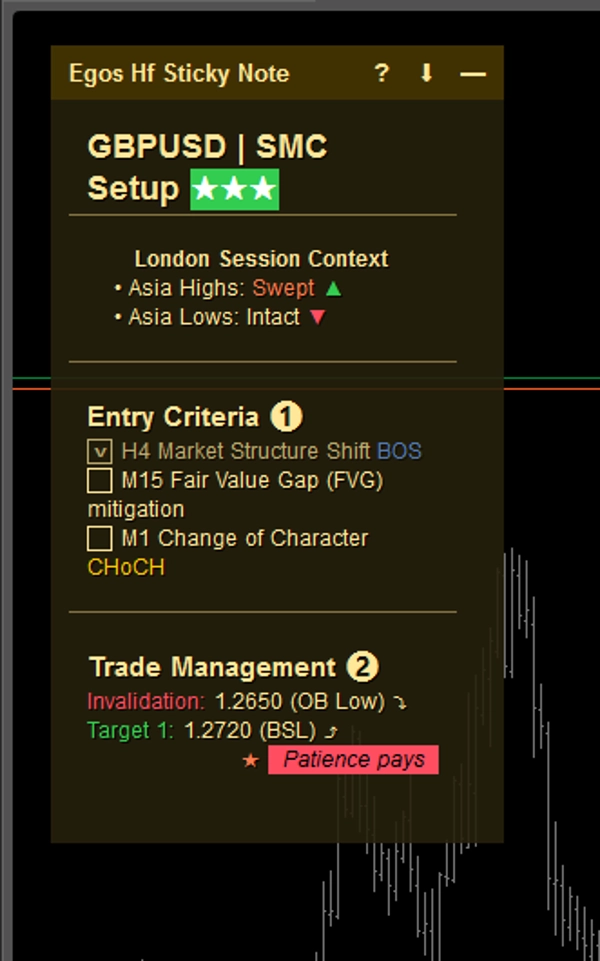
- Senarai Semak Kemasan: Tandakan kriteria tertentu (contohnya, penjajaran EMA, uji semula Tahap Utama) sebelum membuka posisi.
- Pengurusan Risiko: Sematkan had kerugian harian maksimum anda atau amaran berita berimpak tinggi yang akan datang di tempat yang sentiasa boleh anda lihat.
⚡ Ciri Utama & Tafsiran Visual
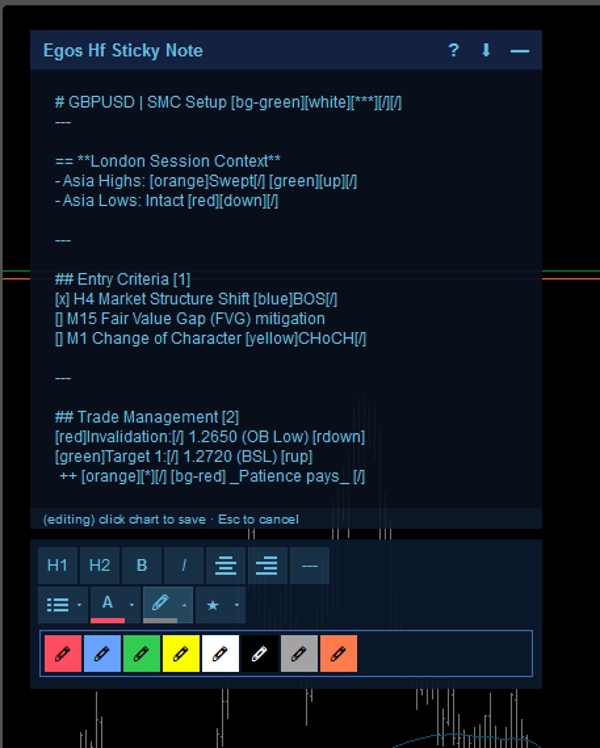
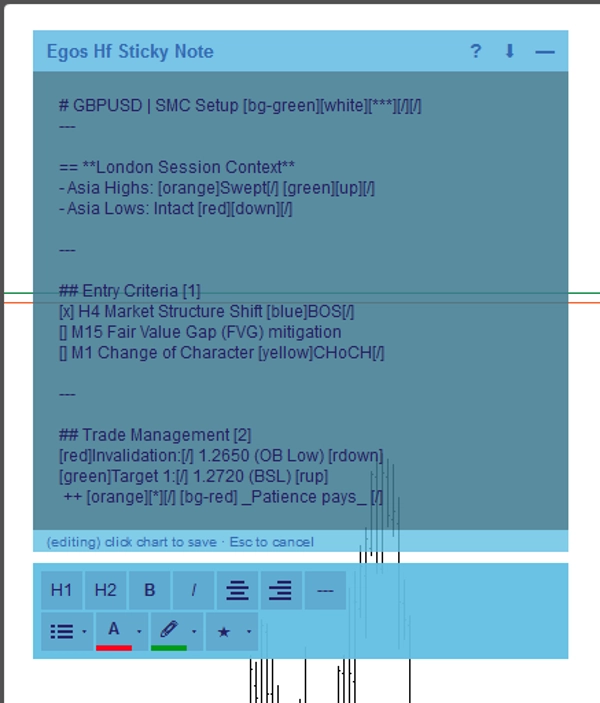
- Pemformatan Markdown: Cipta nota berstruktur menggunakan tag teks mudah. Gunakan
#untuk tajuk,[red]atau[bg-yellow]untuk sorotan warna, dan[x]atau[]untuk kotak semak interaktif. - Simpan Automatik Khusus Simbol: Nota disimpan secara automatik ke storan tempatan per aset pada peranti anda. Tukar dari EURUSD ke XAUUSD, dan nota khusus untuk simbol itu akan dimuatkan serta-merta.
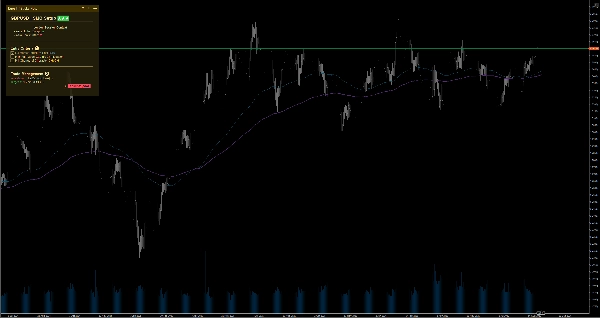
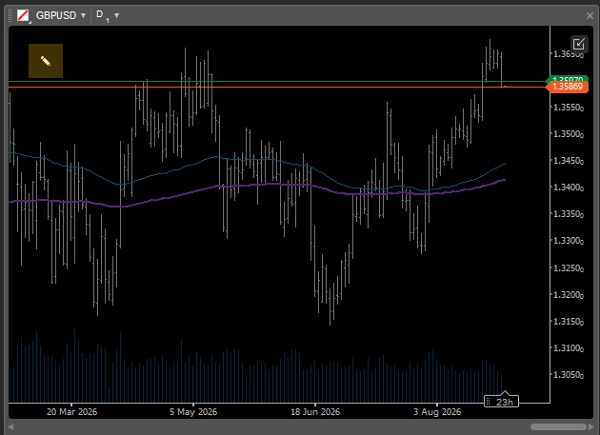
- UI Adaptif Pintar: Apabila menggunakan susun atur pelbagai carta di mana ruang skrin terhad, nota secara automatik mengecil menjadi ikon
✎minimalis supaya ia tidak menghalang tindakan harga. Anda boleh memperbesarkannya dengan mudah bila-bila masa untuk menyemak rekod anda. - Editor WYSIWYG: Klik dua kali nota untuk membuka bar alat terbina dalam bagi pemformatan teks cepat.
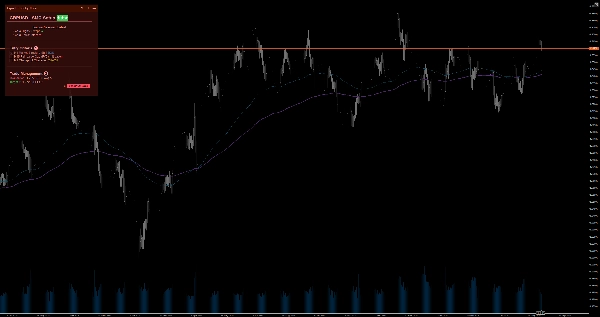
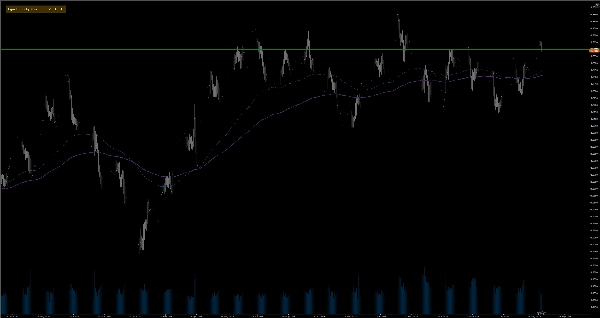
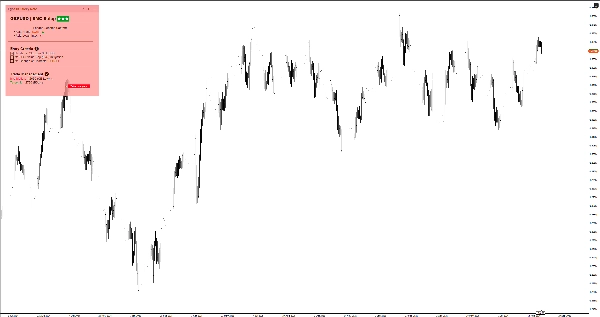
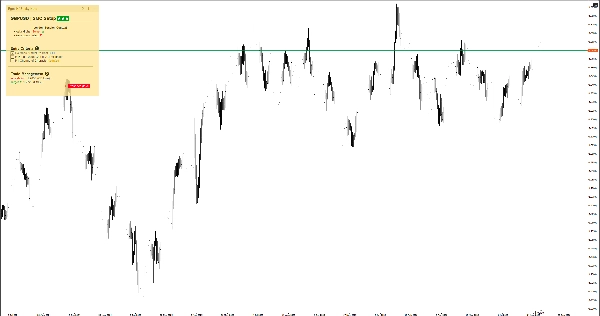
- 6 Tema Warna: Pilih antara tema Terang dan Gelap (Kuning, Merah, Biru) untuk padanan sempurna dengan templat carta anda tanpa membebankan mata. Cukup klik dua kali pada tajuk nota untuk bertukar tema dengan serta-merta tanpa perlu masuk ke tetapan.
⚙️ Tetapan & Parameter Utama
- Penempatan: Sematkan nota ke mana-mana 4 penjuru carta (Atas-Kiri, Atas-Kanan, Bawah-Kiri, Bawah-Kanan).
- Lebar Auto-Kempis (px): Tetapkan ambang lebar carta di mana nota akan mengecil secara automatik.
- Saiz & Margin Lalai: Tetapkan lebar, tinggi, dan margin tepi lalai pilihan anda.
⚠️ Had & Nota Penting
- Ini adalah alat utiliti visual; ia tidak menganalisis data pasaran, menjana isyarat perdagangan, atau melaksanakan perdagangan.
- Semua data disimpan secara tempatan pada peranti anda.
Ringkasan
AI summary
EGOs HF Sticky Note is a visual utility indicator designed for manual traders, Price Action/SMC practitioners, and swing traders who use disciplined, top-down analysis. It provides smart on-chart notes that help maintain focus by keeping trading rules, checklists, and higher timeframe bias visible directly on the chart. The tool supports Markdown formatting with headers, color highlights, and interactive checkboxes, enabling structured note-taking. Notes are saved automatically per trading symbol in local storage, allowing seamless switching between assets with symbol-specific notes loading instantly.
The interface adapts to multi-chart layouts by collapsing into a minimal icon to avoid obstructing price action, expandable on demand. A built-in WYSIWYG editor facilitates quick text formatting. Users can choose from six color themes (light and dark variants) to match chart templates. The note can be positioned in any of the four chart corners, with customizable default size, margins, and auto-collapse width threshold.
Typical use cases include documenting daily/weekly bias for top-down analysis, ticking off entry criteria checklists, and pinning risk management limits or news warnings. This tool does not analyze market data, generate signals, or execute trades; it functions solely as a customizable, on-chart note-taking utility.
Profil indikator
Kategori indikator
Statistik
Jenis output
Visualisasi
Keperluan data
Data luaran
Ulasan pelanggan
0.0
Ulasan: 0
Ulasan pelanggan
Belum ada ulasan untuk produk ini. Anda sudah mencuba produk tersebut? Jadilah yang pertama untuk berkongsi pendapat anda!
Perbincangan
Soalan Lazim
EMA
Key Levels
RSI
Order Block
Volume
Market Structure
Support & Resistance
Produk yang tersedia melalui cTrader Store, termasuk bot dagangan, indikator dan plugin, disediakan oleh pembangun pihak ketiga dan diberikan akses untuk tujuan maklumat dan teknikal sahaja. cTrader Store bukan broker dan tidak memberikan nasihat pelaburan, syor peribadi atau sebarang jaminan prestasi masa hadapan.
Lebih banyak produk daripada penulis ini







Harga
14
Pemasangan percuma