
Description
🚀 EGO's HF Zones Drawing Tool: Lightning-Fast, Pixel-Perfect Zones
Tired of wrestling with native charting tools? Spending too much time manually dragging rectangles instead of actually analyzing the market? Meet your new unfair advantage.
EGO’s HF Zones Drawing Tool is a premium, hotkey-driven utility designed to completely automate and speed up your chart markup routine. Draw, edit, and manage your trading zones with zero friction and mathematical precision.
📊 What Market Data It Analyzes
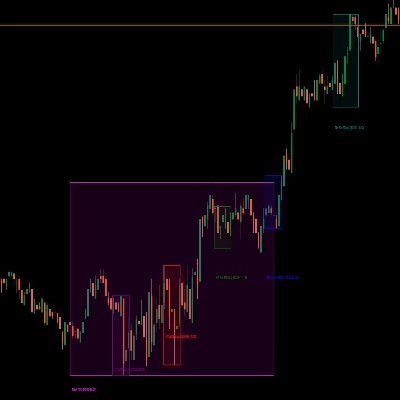
This isn't a basic drawing tool. The indicator instantly analyzes real-time OHLC (Open, High, Low, Close) candlestick data where your mouse is positioned. It calculates the exact spread between the candle's body and wick, automatically generating a pixel-perfect zone that snaps precisely to the market data. No more zooming in to fix sloppy edges!
🎨 Interpreting Signals & Visuals
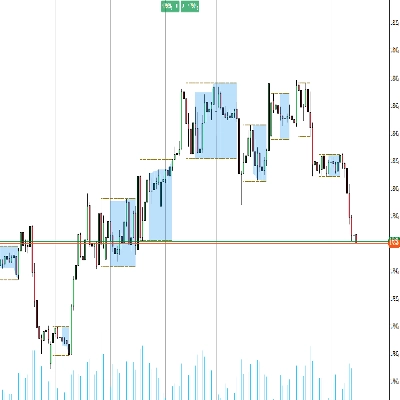
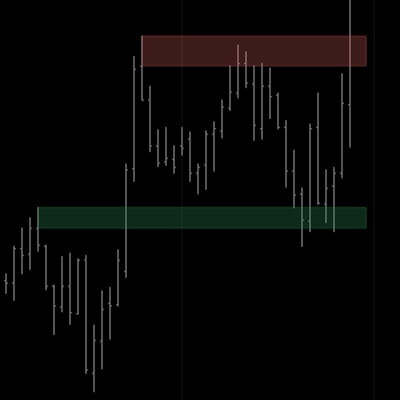
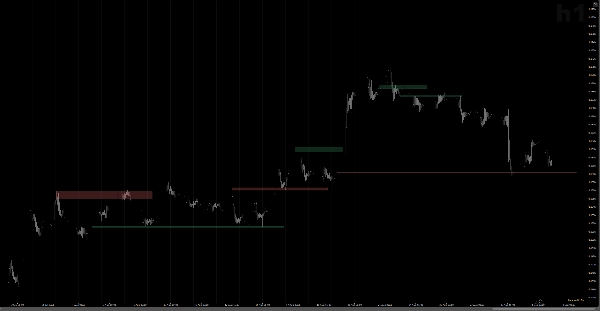
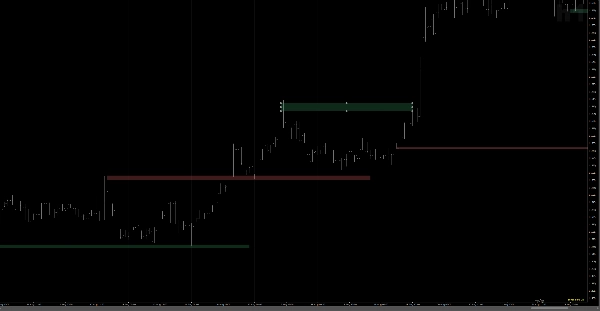
The tool completely automates your color-coding. Based on the underlying candle's direction, it instantly assigns a Bullish (e.g., Demand / Support) or Bearish (e.g., Supply / Resistance) color theme.
- Green/Bullish Zone: Automatically drawn on bullish candles.
- Red/Bearish Zone: Automatically drawn on bearish candles. Need to flip the bias? A simple double-click on the zone instantly swaps its color.
⚙️ Key Settings & Hotkeys (The Magic)
Speed is everything. We’ve replaced tedious menus with intuitive keyboard and mouse combos:
- Double Click or Shift + Click (on empty space): Instantly create a new zone perfectly snapped to the candle under your cursor.
- Double Click (on a zone): Swap the zone's color (Bullish ↔ Bearish).
- Alt + Click (on a zone): Instantly extend the zone into the future by your predefined number of bars.
- Ctrl + Click (on a zone): Re-snap the zone precisely to its origin candle.
- Shift + Click (on a zone): Delete the zone instantly.
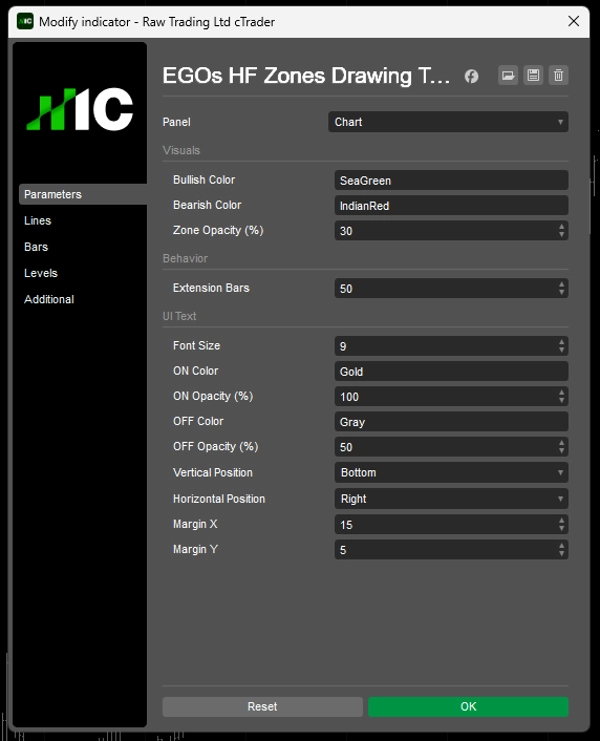
- Customization: Fully adjustable colors, 0-100% opacity, and custom text UI positioning. Press 'H' on your keyboard to toggle a sleek, on-chart cheat sheet so you never forget a shortcut!
🎯 Typical Use Cases & Trading Scenarios
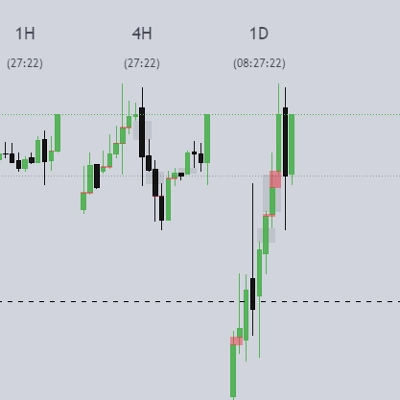
Built specifically for Top-Down Analysis. Whether you are mapping out macro Monthly/Weekly trends or refining H1 execution areas, this tool reduces chart markup time by 80%. It is the absolute best companion for drawing:
- Supply & Demand Zones
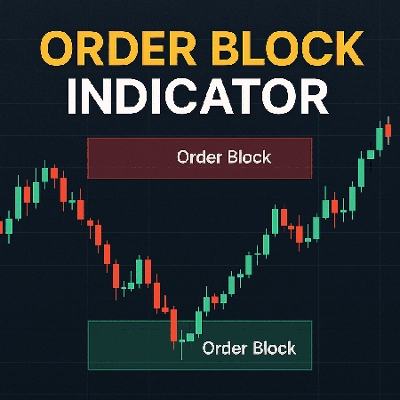
- Order Blocks (OB) & Fair Value Gaps (FVG)
- Key Support & Resistance Levels
- Confluence Zones for breakout or pullback entries.
👤 Who Is This Indicator For?
If your strategy relies on zones, this is mandatory for your toolkit.
- SMC (Smart Money Concepts) & Price Action Traders: Who need surgically precise Order Blocks.
- Swing & Position Traders: Who manage multiple charts and timeframes and want to keep their workspace clean and efficient.
- Experience Level: From beginners who want cleaner, error-free charts, to seasoned professionals who value their time and demand efficiency.
⚠️ Important Notes & Limitations
To ensure blazing-fast performance and avoid conflicting with cTrader's native double-click properties, the tool operates with a brilliant Edit Mode feature.
- Zones Edit: OFF (Default): Zones are locked in place. Your hotkeys (color swap, extend, delete) work instantly without accidentally moving the zone.
- Zones Edit: ON (Press
Right Shift): Zones become "unlocked." You can now use native cTrader functions to manually drag, stretch, or move corners with your mouse.
Stop drawing manual rectangles. Automate your routine, eliminate pixel errors, and trade with absolute precision. Get EGO's HF Zones Drawing Tool today!
Summary
Key features include instant zone creation, resizing, extending, deleting, and re-snapping using intuitive keyboard and mouse shortcuts, eliminating manual rectangle drawing. Users can customize colors, opacity, and text positioning, with an on-chart shortcut reference available.
The tool supports top-down analysis across multiple timeframes, facilitating the marking of supply and demand zones, order blocks, fair value gaps, key support and resistance levels, and confluence zones for breakout or pullback entries. It is suitable for Smart Money Concepts and price action traders, swing and position traders, and users of all experience levels seeking precise, efficient chart markup.
An Edit Mode allows toggling between locked zones for quick hotkey actions and unlocked zones for manual adjustments using native chart functions. This indicator is optimized for cTrader and focuses on visual zone drawing based on bar data.