


Penerangan
Konsep Utama:
Ukuran sokongan dan rintangan klasik “reaksi”: berapa kali harga berubah di sini? CCZ mengukur “penerimaan”: berapa lama harga bersetuju untuk berdagang di sini?
CCZ melakukan ukuran jujur: “Berapa banyak lilin berturut-turut tanpa putus menerima harga ini?”
Kaedah:
1. Ambil sebahagian harga terkini dan potong menjadi jalur mendatar nipis, setiap satu kira-kira pecahan tinggi ATR semasa. Anggapkan mereka sebagai rak.
2. Untuk setiap jalur, lalui lilin dan kira lari terpanjang tanpa putus yang julat tinggi-ke-rendahnya melintasi jalur itu. Satu lilin yang terlepas akan mengakhiri rentetan, dan kiraan bermula semula dari sifar.
3. Mana-mana jalur yang larian terbaiknya melepasi ambang — katakan enam lilin (atau ditetapkan oleh peraturan pengguna sendiri) — menjadi zon.
Peraturan "berturut-turut" adalah keseluruhan idea. Dinding lilin bertindih berturut-turut adalah konsolidasi — rak nilai adil.
─────────────────────────────────────
│ │ │ │ │ │ │ │
▓ ▓ ▓ ▓ ▓ ▓ ✗ ▓ ▓
1 2 3 4 5 6 terlepas 1 2
└── 6 berturut-turut ──┘ ↑ └ larian diset semula
layak jurang
─────────────────────────────────────
Membaca zon
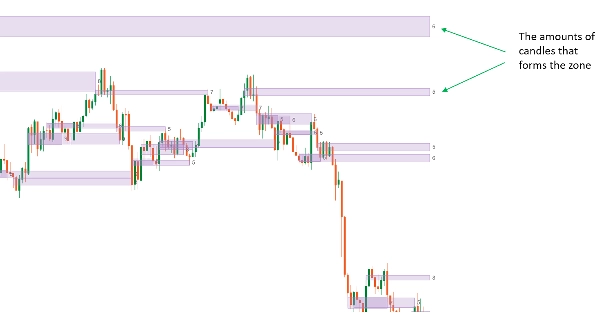
Setiap zon adalah segi empat tepat yang merentasi jalur harga, dengan nombor dicetak padanya. Nombor itu adalah panjang larian lilin terpanjang tanpa putus yang semuanya menyentuh jalur itu — skor kekuatan zon. "6" bermaksud enam lilin berturut-turut berkongsi harga itu; "12" adalah tahap yang lebih dipertandingkan berbanding "6".
Tepi kanan zon melanjut ke hadapan selagi ia kekal relevan. Setelah harga bergerak menjauh dan kemudian kembali, zon itu **dikurangkan** — ia telah diuji dan berhenti melanjut. Anda memilih apa maksud "kembali":
- “Sentuh” — mana-mana sumbu kembali ke zon mengurangkannya (ketat)
- “Tutup di dalam” — hanya lilin yang ditutup di dalam yang dikira (longgar)
- “Sentuh kemudian tutup di dalam” — sumbu dahulu, kemudian lilin kemudian yang tutup di dalam — mengabaikan penolakan sumbu tunggal
Pilihan untuk menyembunyikan zon setelah dikurangkan memastikan carta hanya memaparkan tahap yang masih berperanan.
Pengesanan zon pada mana-mana jangka masa asas
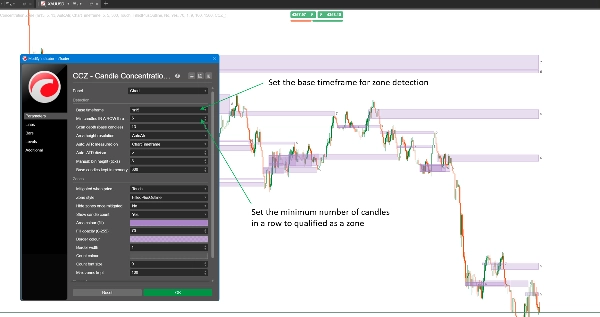
Lilin yang dikira tidak perlu lilin pada carta anda. Tetapkan jangka masa asas sekali — lebih rendah, sama, atau lebih tinggi daripada carta anda — dan zon dibina dari lilin jangka masa itu tidak kira carta mana yang anda lihat.
Jalankan pada lilin H1 semasa berdagang dari carta M5, dan zon yang dibina H1 yang sama terletak pada kedua-dua carta. Zum ke M1 dan ia masih tahap yang sama — anda melihat pandangan diperbesarkan satu pengesanan, bukan satu pengesanan berbeza setiap jangka masa.
Tetapan
- Jangka masa asas — bebas dari carta, mana-mana resolusi
- Lilin minimum berturut-turut diperlukan untuk melayakkan zon
- Kedalaman imbasan — berapa banyak lilin asas yang diliputi oleh tetingkap bergulir
- Resolusi ketinggian kawasan: Auto (berdasarkan ATR) atau Manual (tetap dalam tik)
- Mod auto: ukur ATR pada jangka masa carta atau jangka masa asas, serta pembahagi ATR untuk menetapkan betapa ketat jalur dikira sebagai "tahap yang sama"
- Lilin asas disimpan dalam memori
- Peraturan pengurangan: Sentuh / Tutup di dalam / Sentuh kemudian tutup di dalam
- Gaya zon: hanya garis luar, atau diisi + garis luar, dengan kelegapan isi bebas
- Sembunyikan zon setelah dikurangkan
- Label kiraan lilin: hidup/mati, warna, saiz fon
- Warna dan lebar sempadan, maksimum zon disimpan, bar carta diimbas semasa muat
Penggunaan tipikal
Gunakan ia sebagai pendapat kedua objektif mengenai sokongan dan rintangan anda sendiri — satu tahap hanya muncul kerana lilin berulang kali membuktikan ia penting, bukan kerana ia kelihatan penting pada carta.
Jalankan jangka masa asas lebih tinggi daripada carta kemasukan anda untuk berdagang dari rak jangka masa lebih tinggi yang bersih tanpa menukar tetingkap untuk mencarinya. Atau padankan dengan jangka masa carta anda untuk bacaan tindakan harga tulen di mana sesi semasa terus ditolak.
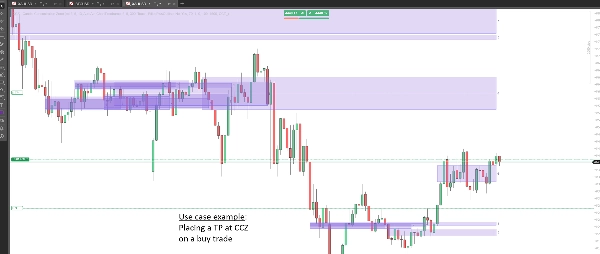
Ia berpasangan secara semula jadi dengan pencetus kemasukan berasingan: gunakan zon sebagai kecenderungan anda untuk mencari pembalikan atau pecahan, dan isyarat anda sendiri bila untuk bertindak ke atasnya. Pada sesetengah kesempatan, anda juga boleh membacanya sebagai kawasan sasaran.
Siapa yang sesuai
Pedagang yang sudah berfikir dalam istilah sokongan, rintangan, atau zon bekalan dan permintaan, dan mahukan cara berasaskan peraturan untuk mencari yang kuat daripada hanya menilai puncak ayunan secara visual. Berguna dari jangka masa scalping hingga perdagangan ayunan, pada forex, indeks, logam, atau kripto. Ia mengandaikan anda sudah mempunyai cara untuk menentukan kemasukan — alat ini mencari tahap, bukan pencetus.
Apa yang tidak dilakukan
- Ia tidak memberikan isyarat beli atau jual, dan tiada harga kemasukan, hentian atau sasaran
- Ia tidak meletakkan pesanan dan tidak boleh mengakses akaun anda — penunjuk berjalan tanpa hak akses sama sekali
- Ia tiada amaran atau pemberitahuan
- Ia tidak mengubah sejarah: hanya lilin yang ditutup dikira, dan nombor kekuatan zon tidak pernah berubah selepas itu. Tepi kanannya terus melanjut ke hadapan setiap bar sehingga zon dikurangkan — itu zon kekal aktif, bukan masa lalu dilukis semula
Perkara yang patut diketahui
Jika anda menetapkan jangka masa asas lebih tinggi daripada carta anda, tukar "ATR diukur pada" ke jangka masa asas juga. Meninggalkannya pada jangka masa carta mengukur lilin jangka masa lebih tinggi dengan pembaris lebih kecil, yang menjadikan jalur harga terlalu nipis dan zon terlalu jarang terbentuk.
Satu zon hanya boleh dianggap dikurangkan selepas harga pertama kali meninggalkannya dan kemudian kembali — zon yang masih terbentuk tidak boleh dikurangkan pada lilin pertamanya sendiri.
Lilin asas jangka masa lebih tinggi bermula pada masa pelayan broker anda. Dua broker boleh memotong lilin jangka masa lebih tinggi yang sama pada titik berbeza secara sah, jadi zon pada simbol yang sama boleh dibaca sedikit berbeza antara broker. Itu adalah sifat data, bukan kesalahan pada penunjuk.
Perdagangan melibatkan risiko. Prestasi lalu tidak menjamin keputusan masa depan.
Ringkasan
Key features include:
- Detection of zones from any user-defined base timeframe, independent of the chart timeframe, allowing higher timeframe zones to be viewed on lower timeframe charts.
- Zones are displayed as rectangles with a strength score indicating the longest consecutive candle count overlapping the zone.
- Mitigation rules determine when a zone is considered tested and no longer extends forward, with options for strict or lenient definitions based on candle touches or closes.
- Customizable settings such as minimum candles in a row, scan depth, band height resolution, zone style, and label display.
- Designed for traders who use support, resistance, or supply and demand concepts and want an objective, rule-based method to identify strong levels.
- Supports markets including forex, indices, metals, and crypto across scalping to swing trading timeframes.
- The indicator does not provide trade signals, alerts, or order execution capabilities and does not repaint historical data.
CCZ serves as a tool to objectively highlight price consolidation zones that can be used as bias areas for potential reversals or breakouts.
Ulasan pelanggan
Perbincangan
Soalan Lazim
Lebih banyak produk daripada penulis ini


















Harga