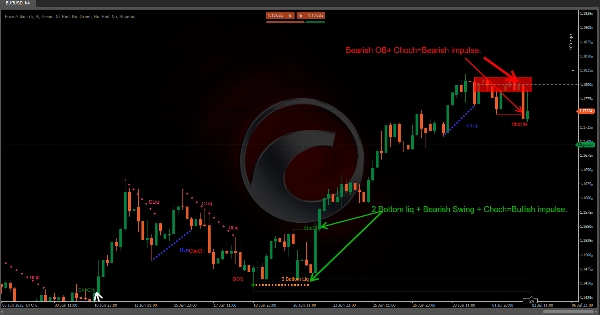
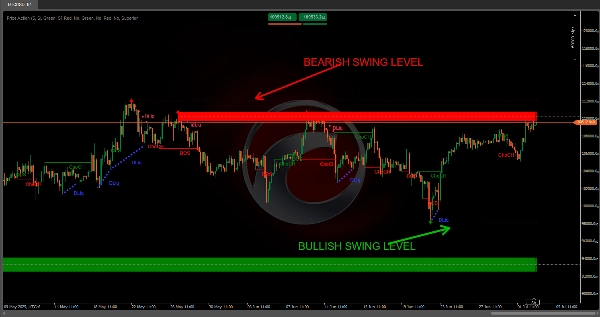
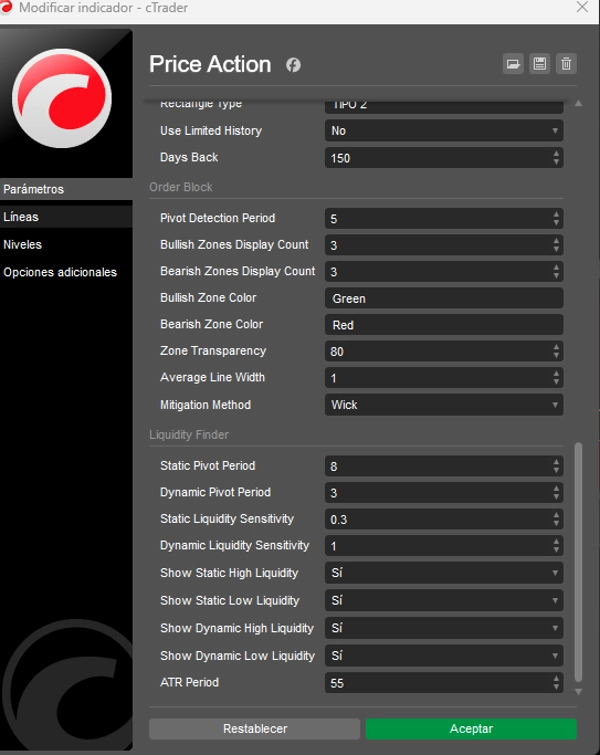
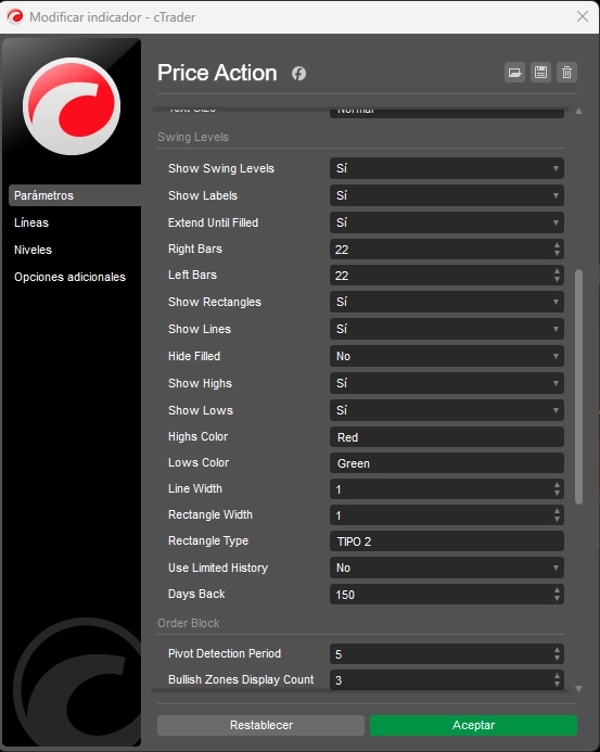
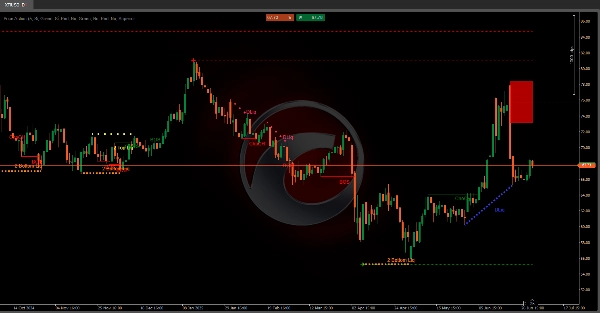
Logo „Price Action”
Price Action
Przesłany obraz „Price Action”
Od 03/10/2024
143
Sprzedaż
32.34K
Bezpłatne instalacje
Indicator profile
0.0
Opinie: 0
Opinie klientów
Ten produkt nie ma jeszcze opinii. Wypróbowałeś(-aś) go już? Bądź pierwszy(-a) i powiedz o tym innym!
Products available through cTrader Store, including trading bots, indicators and plugins, are provided by third-party developers and made available for informational and technical access purposes only. cTrader Store is not a broker and does not provide investment advice, personal recommendations or any guarantee of future performance.

Więcej od tego autora

Logo „ZigZag”
4.3
(6)
Za darmo
ZigZag filters noise, spots trends, patterns, pivots, aiding analysis, trade management, and confirmations. 📉📈
Identify bullish and bearish Order Blocks to spot key support/resistance levels and potential trend reversals! 📈🔄
📊 Shows volume by price levels, highlights POC, and key zones. Identifies dynamic support/resistance and imbalances.
Market structural patterns , specifically the concepts of Change of Character (ChoCH) 🔄 and Break of Structure (BoS) 💥
Adaptive trend channel using linear regression and Pearson correlation for dynamic support, resistance, and trends.
"Identify key market zones and visualize support/resistance from multiple timeframes on a single chart.
📊Zones Supply & Demand: Identifies key price levels with high volume concentration, marking Supply/Demand Zones & Marke
💹 Define a price channel 📈 and determine trend direction (bullish 🟢 or bearish 🔴).
identify and highlight temporary market inefficiencies known as "fair value gaps" 🚨 within specific trading Sessions.
Identify market structure effortlessly with swing highs, lows, CHoCH, and BOS levels for smart trading decisions! 📊🔍"
Detects bullish and bearish divergences
Advanced price action tool that combines multiple technical analysis concepts

Możesz także polubić

Stop drawing levels manually. SmartLevels Pro detects, scores & predicts — H4/H1/M15 · cTrader
Percent Range Keys 000
Institutional FVG detection with HTF projection, precise volume deltas, and smart fill logic.
Automatically calculates the previous day’s high and low, determines the range, and then projects Fibonacci levels.
🚀 Adaptive trailing stop that uses logarithmic normalized volatility....
Pro Volume Profile with Delta, Session Filters & CSV Export. Precision order flow analysis.
Price direction by calculating the probability of reaching new highs/lows. Shows levels & stats📈
A metric that can set 1 to 3 groups of Bollinger Bands
BW_MFI Vizual colors bars
The "Daily Levels" indicator is used to display last week's and yestoday high/low price
The Candle Pressure Index is a powerful, user-friendly indicator that reveals hidden market pressure inside candles.
Advanced price levels! Rounded prices with full style settings. Suitable for all currency pairs and timeframes.
Check the correlations between dozens of assets in one elegant display.
The Advanced CCI & EMA Indicator combines the CCI with 40 & 80 EMA logic to generate precise arrows signaling direction
Detects bullish and bearish divergences
LudwigICT – Digital Root & IDR (cTrader Automate)
Relative Currency Strength 4 Currencies: AUD USD EUR JPY
Advanced price action tool that combines multiple technical analysis concepts
Od 03/10/2024
143
Sprzedaż
32.34K
Bezpłatne instalacje