Opis
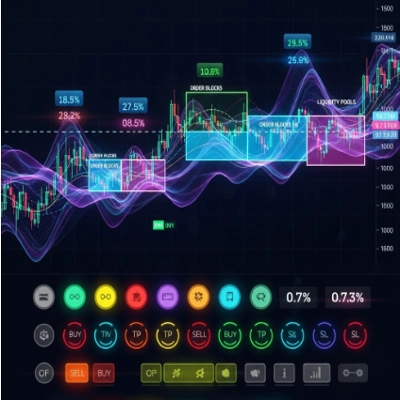
Wskaźnik BLOCK LIQUIDITY łączy dwa główne podejścia do analizy rynku:
Wykrywanie bloków zleceń:
Identyfikuje obszary wsparcia i oporu na podstawie nieprzerwanych maksimów i minimów w okresie retrospektywnym.
Generuje sygnały kupna, gdy cena zamyka się powyżej nieprzerwanego minimum.
Generuje sygnały sprzedaży, gdy cena zamyka się poniżej nieprzerwanego maksimum.
Analiza płynności:
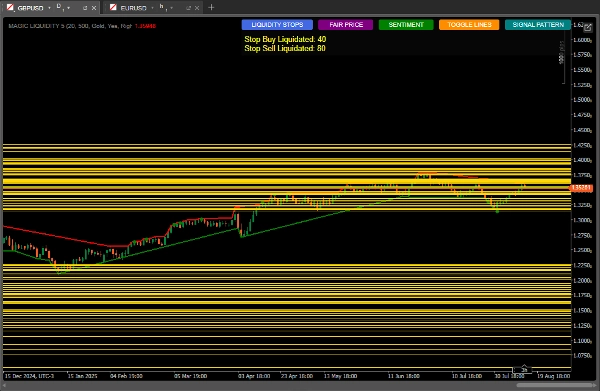
Wykrywa pule płynności (obszary, gdzie mogą być skoncentrowane stop lossy).
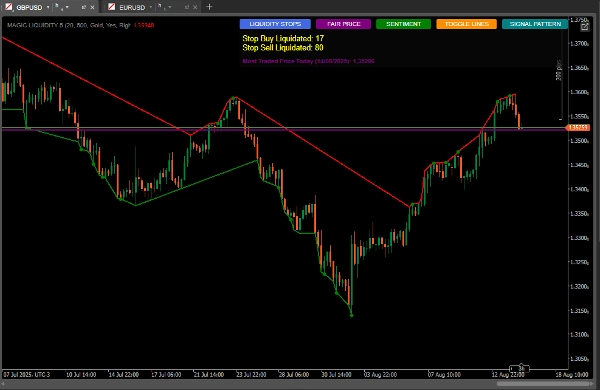
Monitoruje aktywację stopów kupna i sprzedaży.
Oblicza sentyment rynku na podstawie rozkładu płynności.
Identyfikuje najczęściej handlowaną cenę (cenę uczciwą).
Jak używać dla najlepszych rezultatów
Konfiguracja początkowa
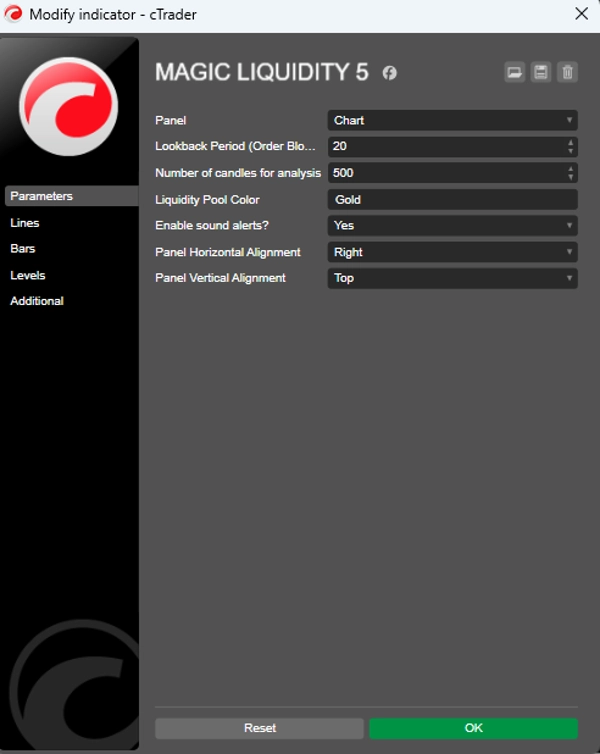
Okres retrospektywny: Dostosuj parametr "Lookback Period" do ram czasowych, na których handlujesz (wyższe wartości dla wyższych interwałów czasowych).
Liczba świec do analizy: Utrzymuj na poziomie 500 dla solidnej analizy lub zmniejsz dla szybszych reakcji.
Kolor puli płynności: Wybierz kolor, który wyróżnia się na twoim wykresie.
Interpretacja sygnałów
Sygnały bloków zleceń:
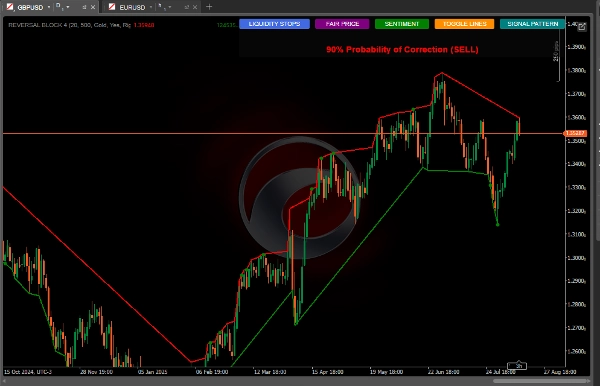
Zielone kropki: sygnały kupna, gdy cena zamyka się powyżej niepokonanego minimum.
Czerwone kropki: sygnały sprzedaży, gdy cena zamyka się poniżej niepokonanego maksimum.
Pule płynności:
Linie poziome pokazują obszary płynności (potencjalne cele lub punkty odwrócenia).
Monitoruj relację między płynnością powyżej/poniżej bieżącej ceny.
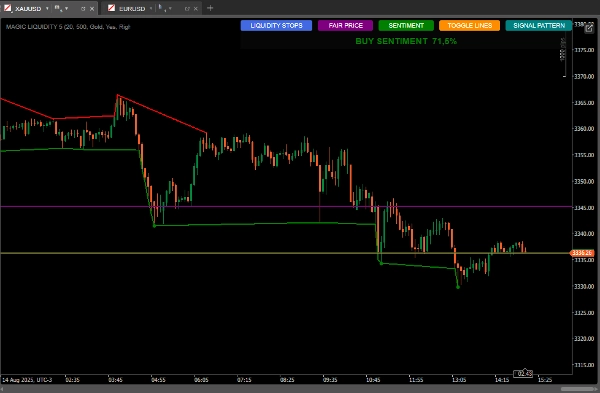
Sentyment rynku:
Użyj przycisku "SENTIMENT", aby zobaczyć dominujący kierunek i pewność.
Sentyment kupna z wysoką pewnością sugeruje kontynuację wzrostu. Sentyment sprzedaży z wysoką pewnością sugeruje kontynuację trendu spadkowego.
Formacje świecowe:
Przycisk "SIGNAL PATTERN" analizuje i
Pokazuje prawdopodobieństwa korekty na podstawie stosunku ilościowego
Najczęściej handlowana cena (cena uczciwa):
Przycisk "FAIR PRICE" pokazuje poziom cenowy z największym wolumenem dnia.
Może działać jak magnes dla cen lub jako wsparcie/opór.
Strategie użytkowania
Strategia konserwatywna:
Handluj tylko wtedy, gdy sygnały bloków zleceń pokrywają się z dominującym sentymentem.
Używaj pul płynności jako celów realizacji zysków.
Strategia agresywna:
Przewiduj odwrócenia, gdy cena zbliża się do pul płynności z wieloma zgromadzonymi stopami.
Wykorzystuj dywergencje między sentymentem a ruchem cen do transakcji przeciwtrendowych.
Dodatkowe potwierdzenie:
Porównaj z formacją świecową pokazaną przez wskaźnik.
Sprawdź, czy cena uczciwa jest w pobliżu jako obszar zainteresowania.
Zarządzanie ryzykiem.
Stop-Loss:
Umieść poniżej najnowszego bloku zleceń dla pozycji kupna
Umieść powyżej najnowszego bloku zleceń dla pozycji sprzedaży
Take-Profit:
Cele w pobliskich pulach płynności
Uwzględnij stosunek płynności powyżej/poniżej do ustalania celów
Zaawansowane wskazówki
Użyj przycisku "TOGGLE LINES", aby wyłączyć linie płynności, gdy wykres stanie się zagracony
Monitoruj liczbę zlikwidowanych stopów, aby ocenić siłę ruchu
Cena uczciwa jest szczególnie przydatna na rynkach ograniczonych zakresem, takich jak dynamiczne wsparcie/opór
Łącz z innymi wskaźnikami dla potwierdzenia (wolumen, średnie kroczące)
Wolumen wskaźnika:
https://ctrader.com/pt/products/635


