
説明
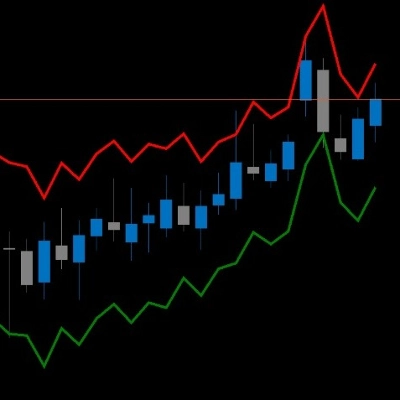
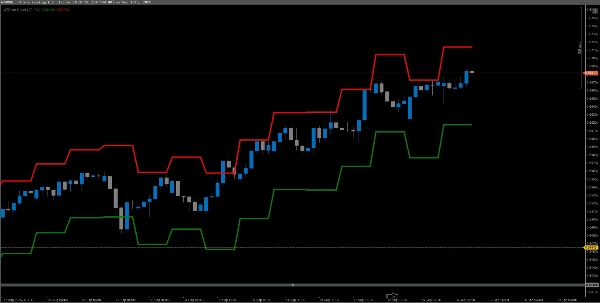
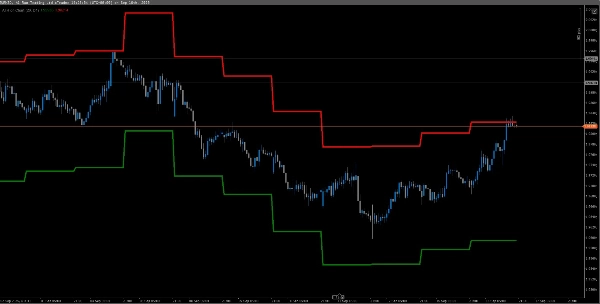
平均真の範囲を表示します。チャート上にATRをプロットして視覚化を容易にし、デフォルトの時間枠は日足ですが、変更することもできます。
概要
AI summary
ATR on Chart is a technical indicator that displays the Average True Range (ATR) directly on the price chart for straightforward visualization. By default, it calculates ATR using the daily timeframe, though users can adjust this setting to other timeframes as needed. This indicator supports various markets including Forex, commodities, indices, and cryptocurrencies, with specific symbols such as BTCUSD, EURUSD, GBPUSD, USDJPY, and XAUUSD among others. It is designed to help traders assess market volatility by plotting ATR values visually, facilitating easier interpretation of price movement ranges.
インジケーターのプロフィール
カスタマーレビュー
0.0
レビュー: 0
カスタマーレビュー
この商品にはまだレビューがありません。お使いになったことがある方は、ぜひレビューをお願いします。
ディスカッション
よくあるご質問
BTCUSD
Forex
Signal
Indices
EURUSD
Commodities
GBPUSD
Crypto
XAUUSD
ATR
USDJPY
cTrader Storeで入手可能な取引ボット、インジケーター、プラグインなどの商品は、第三者の開発者が提供するものであり、情報と技術の取得のみを目的としてご利用いただけます。cTrader Storeはブローカーではなく、投資助言や個人的な推奨を行うことも、将来のパフォーマンスを保証することもありません。
















価格
登録日 11/09/2025
295
無料インストール