Penerangan
📊 Trading Pro Market
https://chartshots.spotware.com/c/69f0ec41d4cfc
Saluran tren + ramalan harga + zon sokongan & rintangan automatik — semua dalam satu penunjuk lapisan
🔍 Apa itu?
https://chartshots.spotware.com/c/69f0ec1fa9930
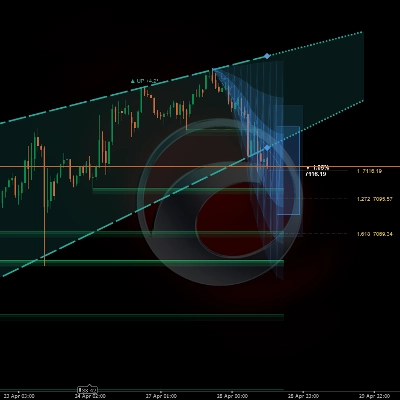
Trading Pro Market adalah penunjuk analisis teknikal lanjutan yang menggabungkan tiga enjin bebas ke dalam satu alat: saluran tren dengan unjuran ke hadapan, sistem ramalan harga berdasarkan corak pergerakan sejarah, dan pengesan zon sokongan & rintangan automatik. Semua dipaparkan terus pada carta harga — tiada panel berasingan diperlukan.
📐 Modul 1 →Saluran ICP🔮 Modul 2 → Ramalan MFP 🧲 Modul 3 → Zon S/R
https://chartshots.spotware.com/c/69f0ec8faa957
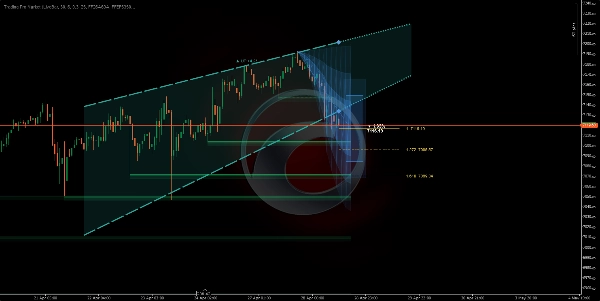
📐 Modul 1 — Saluran tren (ICP)
⚙️ Bagaimana ia mengesan tren?
Penunjuk membahagikan bar yang kelihatan kepada blok masa (lalai: 30 bar setiap blok, 6 blok keseluruhan). Di dalam setiap blok, ia mengira titik tengah geometri antara harga tertinggi dan terendah menggunakan skala harga logaritma. Ia kemudian menghubungkan titik tengah tersebut merentasi blok untuk menentukan sama ada harga sedang tren naik, turun, atau bergerak mendatar.
Kecerunan garis sambungan itu ditukar menjadi sudut yang dinyatakan dalam darjah. Jika sudut jatuh di bawah ambang yang ditetapkan (lalai 0.3°), pasaran diklasifikasikan sebagai bergerak mendatar. Di atas ambang itu, penunjuk menetapkan arah bullish atau bearish.
💡 Volatiliti diukur menggunakan penaksir Yang-Zhang — formula statistik yang menggunakan harga buka, tutup, tinggi, dan rendah untuk mengira volatiliti pasaran sebenar. Nombor ini menormalkan sudut supaya saluran berfungsi dengan konsisten merentasi mana-mana aset atau jangka masa.
🎨 Apa yang dilukis pada carta?
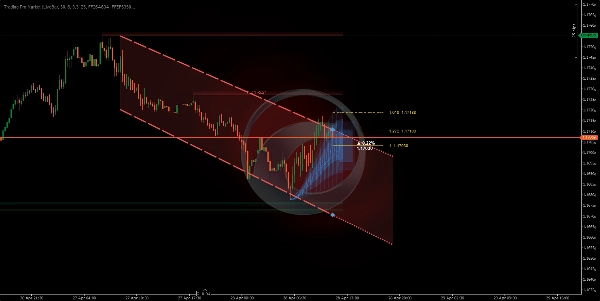
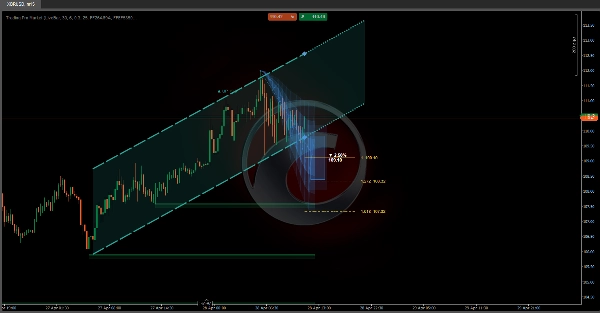
Ia melukis dua garis membentuk saluran (siling dan lantai), dengan zon isian berbayang di antara mereka. Di sebelah kanan, saluran melanjut sebagai unjuran bertitik mengikuti kecerunan semasa. Warna berubah secara automatik berdasarkan arah:
🟢 Hijau — tren bullish🔴 Merah — tren bearish⬜ Kelabu — pasaran bergerak mendatar
🔁 Mesin keadaan — di mana harga berada dalam saluran?
Penunjuk menjejaki kedudukan masa nyata harga penutupan berbanding sempadan saluran dan mengklasifikasikan situasi kepada lima keadaan berbeza:
🟦 Dalam→⚡ Pecah→📏 Jauh→↩️ Ujian semula→✅ Disahkan
Setiap keadaan diterangkan dalam teks biasa pada panel maklumat carta, bersama dengan peratusan jarak ke siling atau lantai saluran pada bila-bila masa.
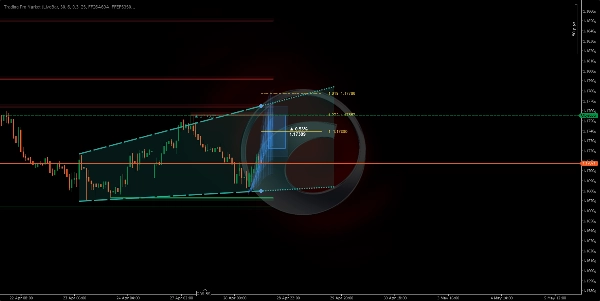
🔮 Modul 2 — Ramalan pergerakan (MFP)
⚙️ Bagaimana ia menjana ramalan?
Enjin mengesan titik pusing harga penting (tinggi dan rendah tempatan) dengan melihat kembali sejumlah bar yang boleh dikonfigurasikan. Setiap titik pusing yang disahkan merekod dua data: peratusan pergerakan harga yang telah selesai dan bilangan bar yang diambil. Sehingga 20 pergerakan sejarah disimpan, dan pergerakan seterusnya dijangka dikira menggunakan salah satu daripada tiga kaedah:
⚖️ Berwajaran — pergerakan terkini diberi lebih berat➕ Purata mudah — semua pergerakan diberi berat sama📊 Median — nilai luar ditapis
🎨 Apa yang dilukis pada carta?
Tiga elemen visual pilihan diproyeksikan ke masa depan berdasarkan asal titik pusing semasa:
1
🔵 Zon Unjuran: tiga lapisan kelegapan menurun yang menggambarkan julat kemungkinan pergerakan. Kon yang lebih lebar bermakna ketidakpastian yang lebih besar berdasarkan varians sejarah.
2
🎯 Kotak sasaran: segi empat tepat yang diletakkan pada harga destinasi anggaran, dengan pergerakan peratusan yang dijangka dan tahap harga tepat dilabelkan dalam teks.
3
📏 Tahap Fibonacci: garis mendatar diproyeksikan dari asal ke destinasi menggunakan nisbah yang boleh dikonfigurasikan (lalai: 1.0, 1.272, dan 1.618).
⚠️ Ramalan tidak meramalkan masa depan. Ia adalah purata statistik pergerakan serupa yang lalu. Nilainya terletak pada menetapkan jangkaan realistik untuk magnitud dan tempoh — bukan sebagai isyarat masuk atau keluar berdiri sendiri.
🧲 Modul 3 — Zon sokongan & rintangan
⚙️ Bagaimana ia mengesan zon?
Setiap kali titik pusing disahkan, penunjuk melukis zon mendatar menggunakan ATR (Julat Benar Purata) untuk menentukan ketebalan zon. Zon rintangan dilukis dengan warna merah, zon sokongan dengan warna hijau — kedua-duanya dengan dua lapisan kelegapan untuk mencipta kedalaman visual dan kejelasan.
Zon berkelakuan dinamik: jika harga ditutup di sebelah lain zon, ia ditandakan sebagai "pecah" — bertukar kepada garis bertitik dengan kelegapan dikurangkan. Zon hilang secara automatik selepas bilangan bar yang dikonfigurasikan dalam "Jangka Hayat Zon".
🚀 Cara menggunakannya
1
Sahkan tren: periksa warna dan arah saluran. Sudut dalam darjah memberitahu anda betapa kuatnya tren — sudut yang lebih curam bermakna momentum lebih tinggi.
2
Baca keadaan harga: panel maklumat pada carta menerangkan sama ada harga berada dalam, memecah, atau menguji semula sempadan saluran secara masa nyata.
3
Nilai unjuran: kon dan kotak sasaran memberikan rujukan tentang di mana dan sejauh mana harga boleh bergerak, berdasarkan perpustakaan corak sejarah yang dibina sepanjang sesi.
4
Hormati zon: kotak S/R yang tidak pecah menandakan tahap harga di mana pasaran pernah bertindak balas. Zon yang belum ditembusi membawa lebih banyak kepentingan daripada yang sudah ditembusi.
🖥️ Keserasian & keperluan
✅ cTrader✅ cAlgo API✅ Mana-mana aset✅ Mana-mana jangka masa✅ Lapisan harga
Tiada akses internet atau kebenaran khas diperlukan. Semua pengiraan dilakukan secara tempatan menggunakan data harga yang sudah tersedia dalam platform.
⏱️ Untuk hasil terbaik, gunakan pada jangka masa 15 minit atau lebih tinggi. Pada jangka masa sangat rendah (1–5 minit) bunyi pasaran boleh menghasilkan titik pusing dengan kebolehpercayaan statistik rendah, mengurangkan kualiti kedua-dua zon S/R dan ramalan.
Ringkasan
Ulasan pelanggan
5 | 0 % | |
4 | 100 % | |
3 | 0 % | |
2 | 0 % | |
1 | 0 % |