
Opis
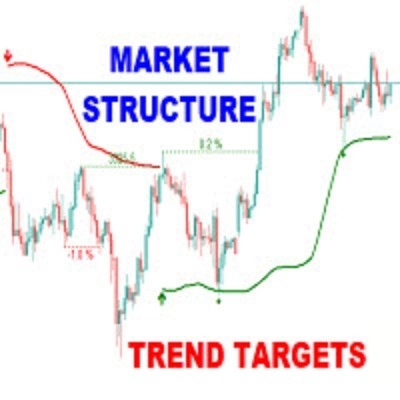
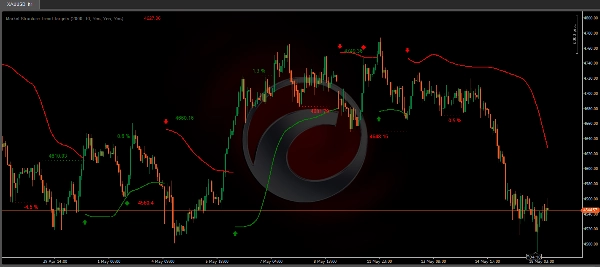
Market Structure Trend Targets jest potężnym wskaźnikiem handlowym zaprojektowanym, aby dać traderom jasny, uporządkowany i oparty na danych obraz momentum rynku, wybicia i kluczowych stref reakcji cenowej. Oparty na zasadach inteligentnej analizy struktury rynku, pomaga identyfikować nie tylko kierunek trendu, ale także precyzyjne poziomy wybicia, wyczerpanie trendu oraz potencjalne strefy odwrócenia — wszystko to z wizualną przejrzystością i przyjaznymi dla tradera metrykami.
Kluczowe cechy
Punkty wybicia z ponumerowanymi znacznikami
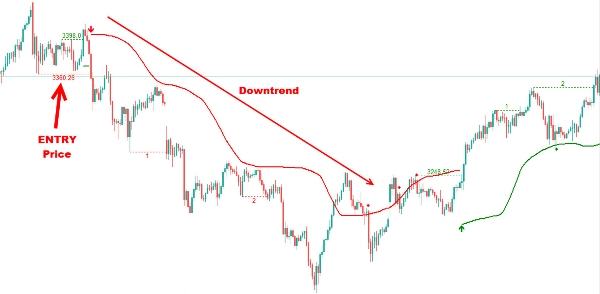
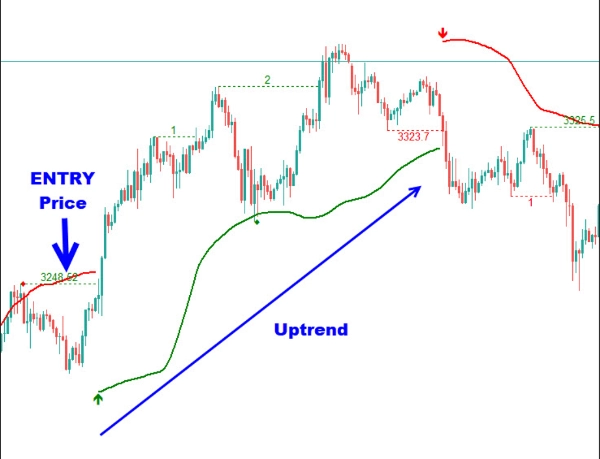
Śledź istotne strukturalne wybicia za pomocą sekwencyjnych ponumerowanych znaczników, które pomagają wizualnie śledzić postęp ruchu cenowego. Niezależnie od tego, czy rynek jest w trendzie wzrostowym czy spadkowym, każdy punkt wybicia jest rejestrowany i wyświetlany, aby ułatwić cofanie się i potwierdzanie zmian strukturalnych. Początkowe wybicie (zero break) jest oznaczone ceną wejścia i ikoną strzałki, podczas gdy kolejne wybicia w trendzie są numerowane kolejno (1, 2, 3…), aby wskazać kontynuację trendu.
Zmiana procentowa
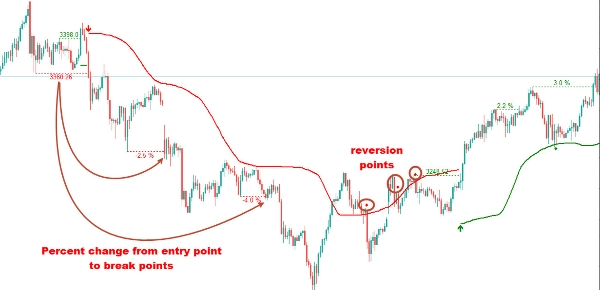
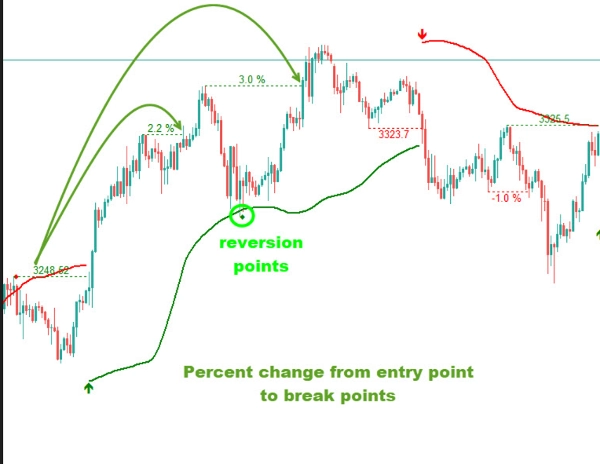
Zobacz dokładnie, o ile cena zmieniła się od każdego punktu wybicia dzięki etykietom zmiany procentowej. Daje to realne poczucie siły rynku, zmienności i potencjalnego wyczerpania, pomagając ocenić, czy ruch nadal ma paliwo — czy zbliża się do swojego limitu.
Poziomy trailing stop loss
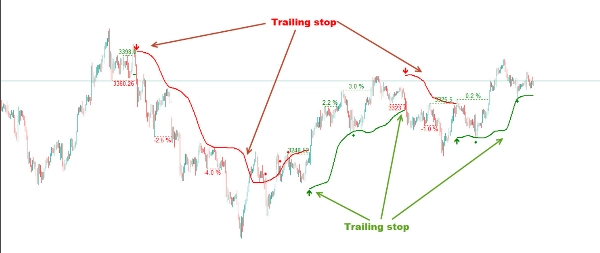
Ten wskaźnik automatycznie oblicza dynamiczne poziomy stop loss na podstawie ostatnich punktów zwrotnych struktury, potwierdzenia wybicia i zmienności. Te inteligentne poziomy dostosowują się wraz z ruchem ceny, pomagając traderom podążać za trendami, jednocześnie precyzyjnie zarządzając ryzykiem. Jeśli cena przebije poziom stop loss, wskaźnik pokaże punkty wskazujące na potencjalne zakończenie lub odwrócenie trendu.
Sygnały odwrócenia
Wskaźnik identyfikuje potencjalne punkty powrotu do średniej za pomocą ikon diamentów. W trendzie wzrostowym, jeśli cena spadnie poniżej stop loss, a następnie ponownie wejdzie powyżej niego, pojawia się diament, sugerując możliwy powrót do średniej. Podobnie w trendzie spadkowym, jeśli cena wzrośnie powyżej stop loss, a następnie ponownie spadnie poniżej, wskazuje to na możliwość odwrócenia.
Przypadki użycia:
- Strategie podążania za trendem oparte na strukturze rynku
- Potwierdzenie dla ustawień Smart Money Concepts (SMC)
- Dynamiczne ustalanie celów i stopów dla traderów swingowych i intraday
- Wizualne prowadzenie dziennika transakcji i śledzenie wybicia
Dane wejściowe użytkownika:
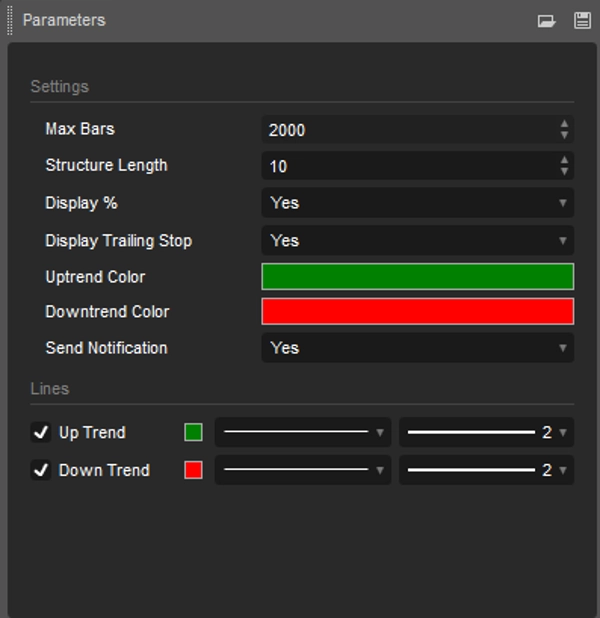
- Długość: Definiuje liczbę słupków używanych do identyfikacji lokalnych maksimów i minimów dla wybicia trendu.
- Wyświetlanie procentowe: Opcja przełączania między wyświetlaniem kolejnych numerów wybicia a zmianą procentową od początkowego wybicia.
- Wyświetl trailing stop: Pokaż trailing stop na wykresie
- Kolory dla trendu wzrostowego i spadkowego: Pozwala na dostosowanie kolorów stref dla trendów wzrostowych i spadkowych, aby dopasować je do indywidualnych preferencji wykresu.
- Alert/Powiadomienie: Pozwala na wysyłanie alertów lub powiadomień na telefon
Market Structure Trend Targets przekształca ruch cenowy w praktyczne, łatwe do odczytania informacje — dając traderom taktyczną przewagę dzięki jasności, kontroli i pewności siebie.
Podsumowanie
Key features include:
- Sequential numbered markers for breakout points, starting with an initial breakout marked by an entry price and arrow, followed by numbered continuation breakouts.
- Percentage change labels showing price movement from each breakout point to assess market strength and potential exhaustion.
- Dynamic trailing stop loss levels calculated from recent pivots and volatility, adjusting as price moves to help manage risk and trail trends.
- Reversion signals marked by diamond icons indicating possible mean reversion points when price crosses trailing stops in either trend direction.
User inputs allow customization of pivot length, display options for breakout numbers or percentage changes, trailing stop visibility, color settings for uptrends and downtrends, and alert notifications.
Use cases include trend-following strategies, confirmation for Smart Money Concepts setups, dynamic target and stop placement for swing and intraday trading, and visual trade journaling with breakout tracking. The indicator outputs visual signals on price charts to support decision-making based on market structure shifts.















![Logo „[Stellar Strategies] VBO”](https://cdn.ctrader.com/image/webp/f034c012-94d4-445a-a01b-febd1cdedaef_36944)











