
Açıklama
🚀 EGO'nun HF Bölgeleri Çizim Aracı: Yıldırım Hızında, Piksel Mükemmelliğinde Bölgeler
Yerel grafik araçlarıyla uğraşmaktan bıktınız mı? Piyasayı gerçekten analiz etmek yerine dikdörtgenleri manuel olarak sürüklemekle çok mu zaman harcıyorsunuz? Yeni haksız avantajınızla tanışın.
EGO’nun HF Bölgeleri Çizim Aracı, grafik işaretleme rutininizi tamamen otomatikleştirmek ve hızlandırmak için tasarlanmış, kısayol tuşlarıyla çalışan premium bir yardımcıdır. Ticaret bölgelerinizi sıfır sürtünme ve matematiksel hassasiyetle çizin, düzenleyin ve yönetin.
📊 Hangi Piyasa Verilerini Analiz Eder
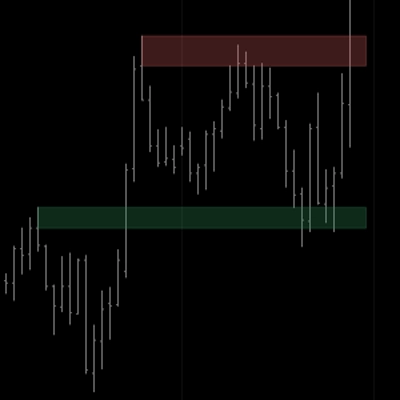
Bu basit bir çizim aracı değildir. Gösterge, farenizin konumlandığı yerde gerçek zamanlı OHLC (Açılış, Yüksek, Düşük, Kapanış) mum çubuğu verilerini anında analiz eder. Mumun gövdesi ile fitil arasındaki tam farkı hesaplar ve piyasa verilerine tam olarak yapışan piksel mükemmelliğinde bir bölge otomatik olarak oluşturur. Artık kötü kenarları düzeltmek için yakınlaştırmaya gerek yok!
🎨 Sinyallerin ve Görsellerin Yorumlanması
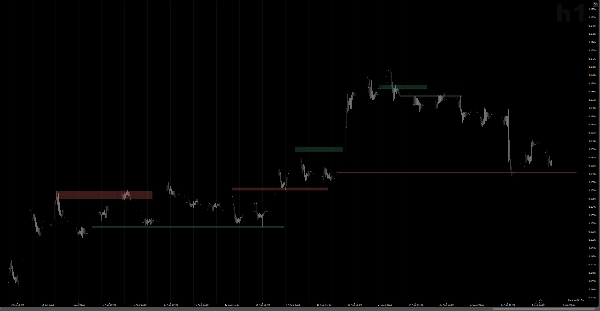
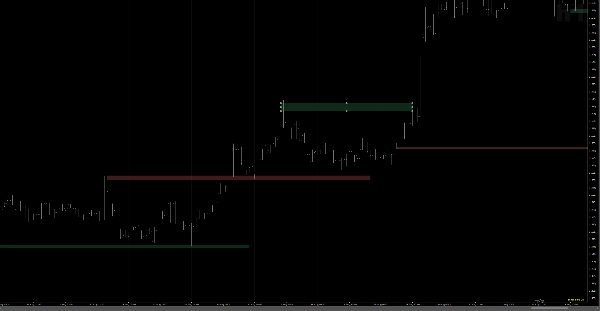
Araç renk kodlamanızı tamamen otomatikleştirir. Altındaki mumun yönüne bağlı olarak, anında bir Boğa (örneğin, Talep / Destek) veya Ayı (örneğin, Arz / Direnç) renk temasını atar.
- Yeşil/Boğa Bölgesi: Boğa mumlarında otomatik olarak çizilir.
- Kırmızı/Ayı Bölgesi: Ayı mumlarında otomatik olarak çizilir. Eğilimi değiştirmek mi istiyorsunuz? Bölgeye basit bir çift tıklama rengi anında değiştirir.
⚙️ Temel Ayarlar ve Kısayollar (Sihir)
Hız her şeydir. Sıkıcı menüleri sezgisel klavye ve fare kombinasyonlarıyla değiştirdik:
- Çift Tıklama veya Shift + Tıklama (boş alanda): İmlecinizin altındaki muma mükemmel şekilde yapışan yeni bir bölge anında oluşturulur.
- Çift Tıklama (bir bölgede): Bölgenin rengini değiştirir (Boğa ↔ Ayı).
- Alt + Tıklama (bir bölgede): Bölgeyi önceden tanımladığınız bar sayısı kadar geleceğe anında uzatır.
- Ctrl + Tıklama (bir bölgede): Bölgeyi tam olarak orijinal mumuna yeniden yapıştırır.
- Shift + Tıklama (bir bölgede): Bölgeyi anında siler.
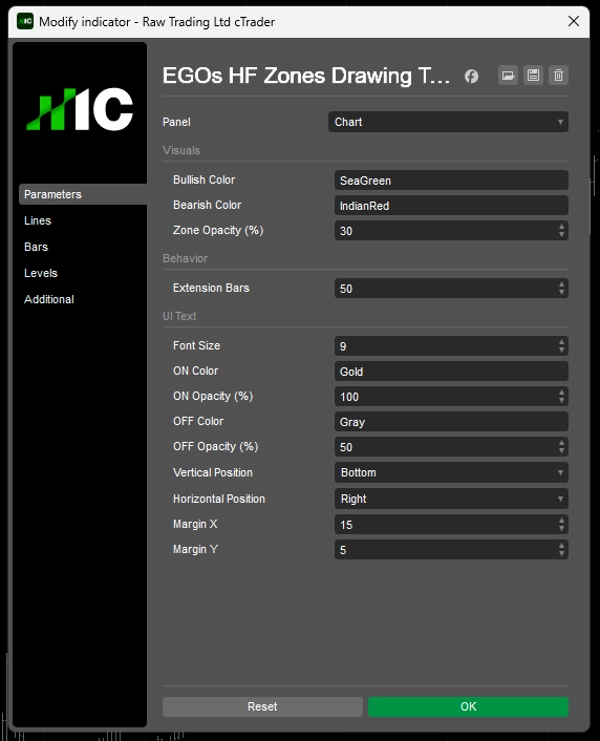
- Özelleştirme: Tamamen ayarlanabilir renkler, %0-100 opaklık ve özel metin UI konumlandırması. Kısayolları asla unutmamanız için klavyenizdeki 'H' tuşuna basarak şık, grafik üzerinde bir yardım sayfasını açıp kapatabilirsiniz!
🎯 Tipik Kullanım Durumları ve Ticaret Senaryoları
Özellikle Yukarıdan Aşağı Analiz için tasarlanmıştır. İster makro Aylık/Haftalık trendleri haritalıyor olun, ister H1 yürütme alanlarını inceliyor olun, bu araç grafik işaretleme süresini %80 azaltır. Çizim için en iyi yardımcıdır:
- Arz ve Talep Bölgeleri
- Emir Blokları (OB) ve Adil Değer Boşlukları (FVG)
- Ana Destek ve Direnç Seviyeleri
- Kırılma veya geri çekilme girişleri için örtüşme bölgeleri.
👤 Bu Gösterge Kimler İçin?
Stratejiniz bölgeler üzerine kurulmuşsa, bu araç setiniz için zorunludur.
- SMC (Akıllı Para Kavramları) ve Fiyat Aksiyon Traderları: Cerrahi hassasiyette Emir Bloklarına ihtiyaç duyanlar.
- Swing ve Pozisyon Traderları: Birden fazla grafik ve zaman dilimini yöneten ve çalışma alanlarını temiz ve verimli tutmak isteyenler.
- Deneyim Seviyesi: Daha temiz, hatasız grafikler isteyen acemilerden, zamanına değer veren ve verimliliği talep eden deneyimli profesyonellere kadar.
⚠️ Önemli Notlar ve Sınırlamalar
Yıldırım hızında performans sağlamak ve cTrader'ın yerel çift tıklama özellikleriyle çakışmayı önlemek için araç, parlak bir Düzenleme Modu özelliği ile çalışır.
- Bölgeler Düzenleme: KAPALI (Varsayılan): Bölgeler yerinde kilitlidir. Kısayollarınız (renk değiştirme, uzatma, silme) bölgeyi yanlışlıkla hareket ettirmeden anında çalışır.
- Bölgeler Düzenleme: AÇIK (
Sağ Shifttuşuna basın): Bölgeler "kilitsiz" hale gelir. Artık yerel cTrader işlevlerini kullanarak farenizle köşeleri manuel olarak sürükleyebilir, uzatabilir veya taşıyabilirsiniz.
Manuel dikdörtgen çizmeyi bırakın. Rutininizi otomatikleştirin, piksel hatalarını ortadan kaldırın ve mutlak hassasiyetle işlem yapın. Bugün EGO'nun HF Bölgeleri Çizim Aracını edinin!
Özet
Key features include instant zone creation, resizing, extending, deleting, and re-snapping using intuitive keyboard and mouse shortcuts, eliminating manual rectangle drawing. Users can customize colors, opacity, and text positioning, with an on-chart shortcut reference available.
The tool supports top-down analysis across multiple timeframes, facilitating the marking of supply and demand zones, order blocks, fair value gaps, key support and resistance levels, and confluence zones for breakout or pullback entries. It is suitable for Smart Money Concepts and price action traders, swing and position traders, and users of all experience levels seeking precise, efficient chart markup.
An Edit Mode allows toggling between locked zones for quick hotkey actions and unlocked zones for manual adjustments using native chart functions. This indicator is optimized for cTrader and focuses on visual zone drawing based on bar data.