
Opis
Zaawansowany wskaźnik stref Donchiana dla cTrader
Opanuj trendy rynkowe i wybicia z precyzją!
Przenieś swoje trading na wyższy poziom dzięki Zaawansowanemu wskaźnikowi stref Donchiana – potężnemu narzędziu zaprojektowanemu dla traderów, którzy wymagają dokładności, elastyczności i efektywności. Ten wskaźnik nowej generacji ulepsza klasyczne kanały Donchiana, wprowadzając analizę wielookresową, dostosowywane obliczenia cen, alerty w czasie rzeczywistym oraz wizualizację w chmurze.
Niezależnie od tego, czy handlujesz forexem, akcjami czy towarami, Zaawansowany wskaźnik stref Donchiana wyposaża Cię w narzędzia do identyfikacji wybicia, podążania za trendami i handlu odwróceniami jak profesjonalista.
Kluczowe cechy i korzyści:
1. Wielookresowe strefy Donchiana
- Analizuj strefy Donchiana z wyższego interwału czasowego podczas handlu na niższym, zapewniając zawsze zgodność z większym trendem rynkowym.
- Idealne dla day traderów i swing traderów, którzy chcą zoptymalizować swoje wejścia i wyjścia.
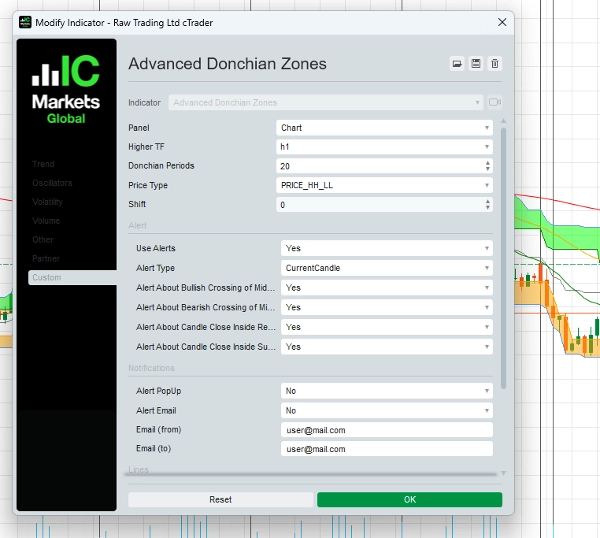
2. Dostosowywane obliczenia cen
- Wybierz spośród pięciu zaawansowanych typów cen, aby dopracować swoją strategię:
-
- Najwyższy szczyt / Najniższy dołek
- Średnia z High/Open lub High/Close
- Najwyższe otwarcie / Najniższe otwarcie
- Najwyższe zamknięcie / Najniższe zamknięcie
- Dostosuj wskaźnik do swojego stylu handlu i zarządzania ryzykiem.
3. Dynamiczne alerty – Nigdy nie przegap okazji!
- Otrzymuj powiadomienia w czasie rzeczywistym, gdy wystąpią kluczowe zdarzenia handlowe:
-
- Przebicia linii środkowej (sygnały bycze lub niedźwiedzie)
- Zamknięcie ceny wewnątrz kluczowych stref (potencjalne strefy odwrócenia lub wybicia)
- Alerty dostępne przez wyskakujące okienka i e-mail, dzięki czemu jesteś na bieżąco z ruchami rynku.
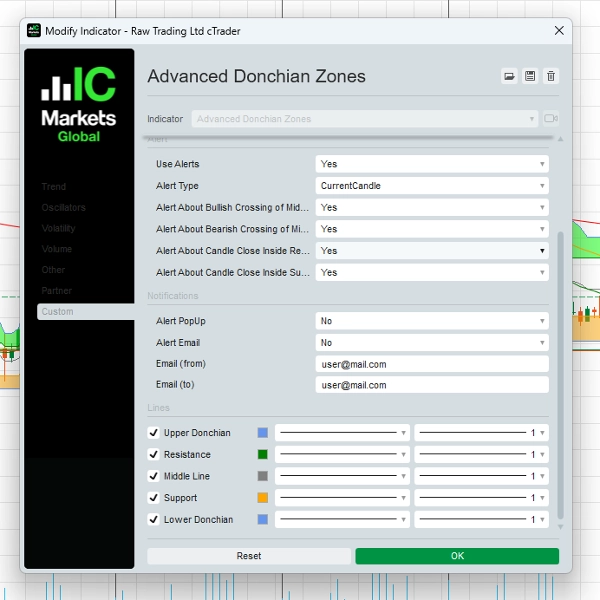
4. Wizualizacja w chmurze dla jasnych wglądów
- Unikalne zacienione strefy pomiędzy poziomami Donchiana pomagają traderom szybko i skutecznie wizualnie identyfikować wsparcie, opór i obszary wybicia.
5. Elastyczny parametr przesunięcia
- Dostosuj pozycjonowanie stref Donchiana do przodu lub do tyłu w czasie, aby precyzyjnie dopasować swoją strategię handlową.
6. Łatwy w użyciu interfejs
- Zaprojektowany dla traderów na każdym poziomie, z intuicyjnym układem i dostosowywanymi ustawieniami dopasowanymi do Twoich preferencji handlowych.
Jak korzystać z Zaawansowanego wskaźnika stref Donchiana
1. Strategia handlu wybiciowego – Łap gwałtowne ruchy!
- Ustawienie:
-
- Zastosuj Zaawansowany wskaźnik stref Donchiana na swoim wykresie.
- Wybierz okres Donchiana (np. 20) oraz wyższy interwał czasowy (np. 1H lub 4H) dla dokładniejszych sygnałów.
- Wejście:
-
- Kupuj, gdy cena przebija i zamyka się powyżej górnej strefy Donchiana.
- Sprzedawaj, gdy cena przebija i zamyka się poniżej dolnej strefy Donchiana.
- Wyjście:
-
- Użyj linii środkowej lub przeciwnej strefy Donchiana jako poziomu wyjścia.
- Przykład:
-
- Handlując na wykresie 15-minutowym, ustaw obliczenia Donchiana na podstawie interwału 1-godzinnego. Gdy cena przebije górny poziom Donchiana, otwórz pozycję kupna ze stop-lossem blisko linii środkowej.
2. Strategia podążania za trendem – Podążaj za momentum rynku
- Ustawienie:
-
- Użyj linii środkowej jako filtru trendu.
- Handluj tylko w kierunku dominującego trendu.
- Wejście:
-
- Kupuj, gdy cena jest powyżej linii środkowej i odbija się od strefy wsparcia.
- Sprzedawaj, gdy cena jest poniżej linii środkowej i odbija się od strefy oporu.
- Wyjście:
-
- Zamknij pozycję, gdy cena przebije linię środkową w przeciwnym kierunku.
- Przykład:
-
- Na wykresie 4-godzinnym cena pozostaje powyżej linii środkowej, potwierdzając trend wzrostowy. Wejdź w pozycję kupna, gdy cena cofnie się do strefy wsparcia i pokaże oznaki odwrócenia.
3. Strategia handlu w zakresie – Zarabiaj na rynkach bocznych
- Ustawienie:
-
- Zidentyfikuj okresy, gdy cena oscyluje pomiędzy górną i dolną strefą Donchiana.
- Wejście:
-
- Kupuj, gdy cena zbliża się do wsparcia.
- Sprzedawaj, gdy cena zbliża się do oporu.
- Wyjście:
-
- Zrealizuj zyski blisko przeciwnej strefy Donchiana lub gdy nastąpi wybicie.
- Przykład:
-
- Na wykresie 1-godzinnym, jeśli cena oscyluje pomiędzy górnym i dolnym poziomem Donchiana, wykonuj transakcje na tych ekstremach, wykorzystując okazje do odwrócenia średniej.
Dlaczego traderzy wybierają Zaawansowane strefy Donchiana
✔ Uniwersalny dla różnych stylów handlu – sprawdza się przy wybiciach, podążaniu za trendem i handlu w zakresie.
✔ Zwiększa precyzję handlu – dokładnie identyfikuje kluczowe poziomy wsparcia i oporu.
✔ Alerty w czasie rzeczywistym – bądź na bieżąco dzięki natychmiastowym powiadomieniom.
✔ Narzędzie klasy profesjonalnej – stworzone dla traderów szukających przewagi na rynku.
Cennik i oferta specjalna
Specjalna cena ograniczona czasowo: 97 USD (płatność jednorazowa)
W skład oferty wchodzi:
- Zaawansowany wskaźnik stref Donchiana dla cTrader
- Kompletny przewodnik użytkownika z instrukcjami krok po kroku
- Bezpłatne aktualizacje przez 1 rok
- Priorytetowe wsparcie e-mailowe
Opinie traderów
„Używam kanałów Donchiana od lat, ale ten wskaźnik przenosi to na inny poziom. Funkcja wielookresowa to prawdziwa rewolucja!”
— Mark S., trader forex
„Alerty i dostosowywane ustawienia cen pomagają mi łapać transakcje wybiciowe z większą pewnością. Gorąco polecam poważnym traderom.”
— Lisa T., swing trader
Zacznij już dziś!
Gotowy, aby odmienić swój trading? Kliknij przycisk poniżej, aby kupić Zaawansowany wskaźnik stref Donchiana i zacząć handlować z precyzją!
[Kup teraz za 97 USD]
30-dniowa gwarancja zwrotu pieniędzy
Stajemy za naszym produktem. Jeśli nie będziesz całkowicie zadowolony, skontaktuj się z nami w ciągu 30 dni, aby otrzymać pełny zwrot pieniędzy – bez zadawania pytań.
Potrzebujesz pomocy? Skontaktuj się z nami!
📧 E-mail: o.elmottaqy@gmail.com
🌐 Strona internetowa: https://t.me/mottaqyo
Zastrzeżenie ryzyka
Trading wiąże się z ryzykiem. Zaawansowany wskaźnik stref Donchiana to narzędzie wspomagające decyzje handlowe, ale nie gwarantuje zysków. Zawsze stosuj odpowiednie zarządzanie ryzykiem i handluj odpowiedzialnie.
Podsumowanie
Key functionalities include real-time alerts via pop-ups and email for significant events such as midline crossovers and price closing inside key zones, helping traders stay informed of potential breakouts or reversals. A unique cloud visualization feature shades zones between Donchian levels to clearly identify support, resistance, and breakout areas. The flexible shift parameter allows users to adjust the positioning of Donchian Zones forward or backward in time for strategy fine-tuning.
Suitable for forex, stocks, and commodities markets, this indicator supports multiple trading strategies including breakout, trend-following, and range-bound trading. It features an intuitive interface designed for traders of all levels. The product includes a comprehensive user guide with step-by-step strategies, free updates for one year, and priority email support.
Opinie klientów
5 | 50 % | |
4 | 50 % | |
3 | 0 % | |
2 | 0 % | |
1 | 0 % |


