
Low Drawdown Prop Firm Robots
Explore low drawdown prop firm robots for cTrader engineered to protect capital during funded challenges. These cBots emphasise tight risk per trade, equity protection and smooth equity curves to keep you inside strict prop limits. Compare best and free low-risk robots built for prop evaluations. Check your firm's automation rules before going live.
Tools
Top-performing bots
Tool comparison
FAQ

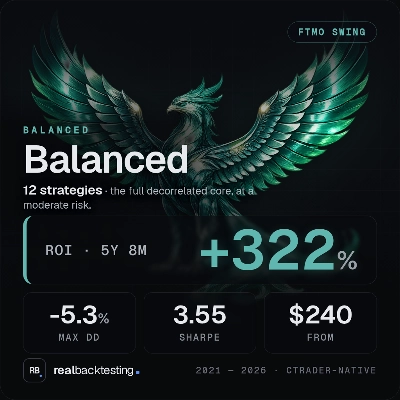
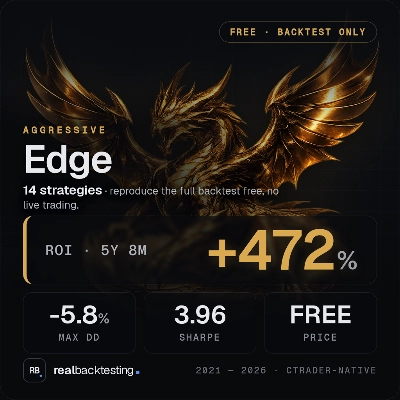

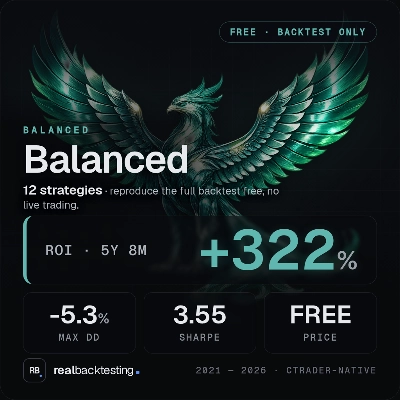

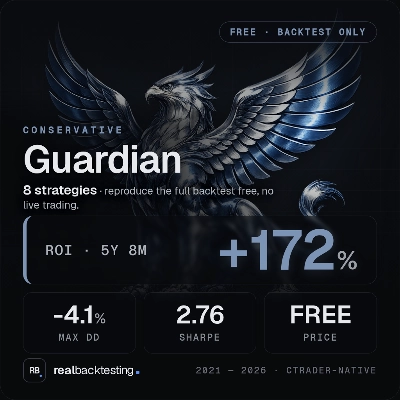













Top-performing bots
Tool comparison
FAQ
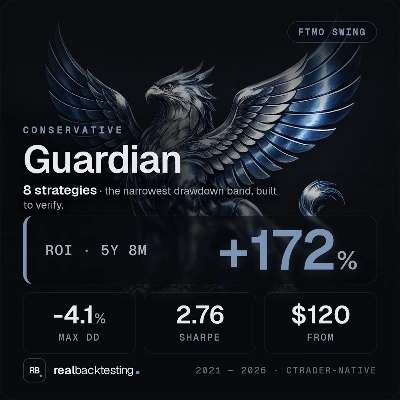
Low drawdown prop firm robots are cBots designed to limit how far equity falls from its peak, often through small risk per trade. The label reflects each seller's design aim and test history, not a promise about future declines.
Drawdown is the fall in balance or equity from a previous high to a later low, shown as an amount or a share of the account. Some measures use closed trades only, while equity-based ones include open positions, so floating losses count as they happen.
Check the maximum equity drawdown over a long test that includes volatile stretches, not only the balance curve, and see how deep the worst losing streak went. If a seller shares live statistics, set them beside the backtest, because a gap between the two is informative.
Yes, strategies that add to losing positions or hold trades without stops can show smooth curves for long periods before one deep fall. Tight risk settings lower the size of losses but do not remove them, and a firm's limits differ by programme and can change.
Backtest it in cTrader Windows or Mac over several years of mixed conditions, then run it on a demo account sized like your challenge. Watch equity rather than balance, and note that a calm test period cannot guarantee a calm future.