Description
Introduction
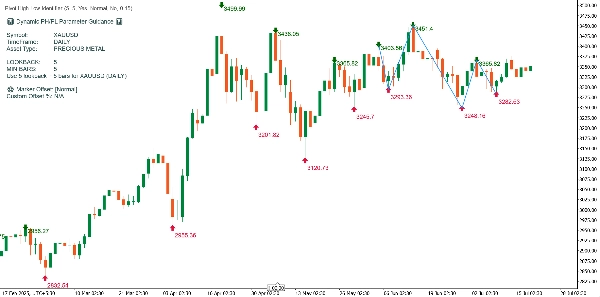
The displayed chart utilizes the custom "Improved PH/PL Visualization" cTrader indicator. This tool dynamically identifies pivotal swing highs and lows (PH/PL), draws zigzag trendlines between them, and generates an informative guidance panel based on the symbol, timeframe, and asset type detected. Below is a detailed breakdown of how the indicator processes and annotates the sample chart.
Key Elements Illustrated on the Chart
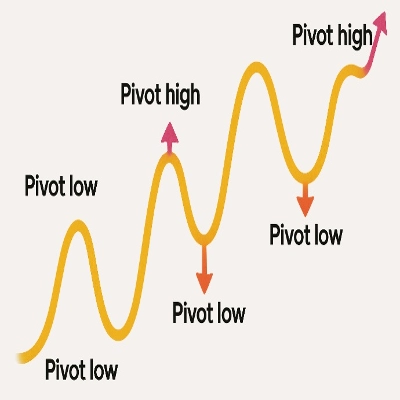
1. Pivot Highs (PH) and Pivot Lows (PL)
- Pivot Highs: Marked with green down arrows and their respective high prices above the bars.
- Pivot Lows: Marked with red up arrows and their respective low prices beneath the bars.
- Logic Used: A PH occurs when a bar’s high is higher than the highs of 'lookback' bars before and after it; a PL is similarly defined for lows.
- Lookback Configuration: In your code and chart, a lookback of 5 is used, yielding robust swing detection well-suited to daily data.
2. Price Labels
- Toggleable Display: Price labels attached to each PH/PL marker can be shown or hidden through the indicator’s parameters. In this example, prices are displayed for clarity.
- Offset Auto-Adjustment: Label positioning is algorithmically offset using the optimal spacing (preset or custom), ensuring text does not overlap candles or chart elements.
3. Dynamic Zigzag Trendlines
- Visualization: Blue zigzag lines connect the most recent and significant PH/PL points, highlighting the sequence of major price swings.
- Purpose: This helps traders visually track changing trends and momentum shifts over the chart's period.
4. Dynamic Guidance Panel
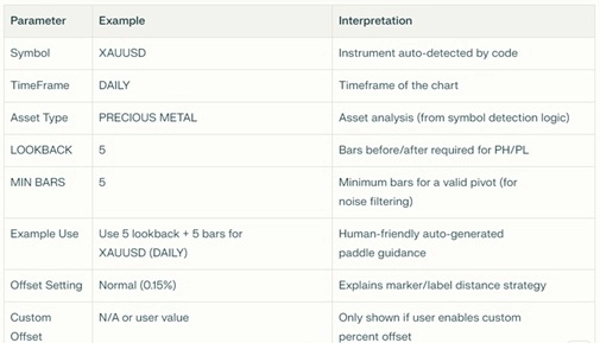
The top-left chart panel summarizes key settings, detection results, and usage recommendations
How the Indicator Works on This Chart
Stepwise Explanation:
- Swing Identification:
The indicator scans each daily bar after initialization, comparing highs and lows over a five-bar window on each side to pinpoint PH and PL. - Marker Placement:
PHs and PLs are marked using colored arrows; their corresponding price labels are positioned at an optimal distance to ensure clarity. - Trend Visualization:
The algorithm selects the most recent 10 pivots (PH/PL, configurable) and draws blue lines connecting them, mapping out the major market swings and assisting in trend recognition. - Parameter Panel:
The display panel confirms the auto-detection of the asset type (here: XAUUSD, a "PRECIOUS METAL") and provides users with optimal recommended values for lookback, min bars, and offset for this combination—all visible briefly. - Smart Asset Adaptation:
If you apply this indicator to another symbol (such as a forex exotic, crypto, or stock index), the guidance panel and detection logic adjust automatically, setting recommended lookback and min bars for that specific market behavior and timeframe. - Clean Chart Experience:
All graphical objects drawn (arrows, trend lines, price labels, static text) are cleaned and redrawn each calculation to avoid clutter. The indicator always overlays its information on the price chart, never in a separate panel.
Practical Takeaways for Trading
- Swing Structure Recognition: You can quickly read the sequence and magnitude of market swings.
- Entry/Exit Planning: The PH/PL turns can be used for trailing stop logic or anticipating potential reversal points.
- Universal Use: No matter the asset or timeframe, the indicator self-tunes and explains its recommendations.
- Clear, Professional Visuals: Price clutter and label overlap are minimized due to smart offsetting.
Summary
This chart demonstrates the power and clarity of the Improved PH/PL Visualization. The indicator provides the trader with immediate visual cues on major pivot points, the direction and size of swings, and contextual guidance specific to the instrument and timeframe. Everything is automated, up-to-date, and customizable for any asset or market environment.
Note: Due to limitations in cTrader the indicator shows option to place the indicator on a new panel but that will not be applicable since the indicator cannot be viewed in new panel due to its size and functioning. Also, if prices are being printed too far from pivot arrows and it gets confusing for the user then the user can manually choose to display prices or not.
If you need further customization, like sound/alert signals at pivots, or dynamic filtering for smaller swings, just ask!


