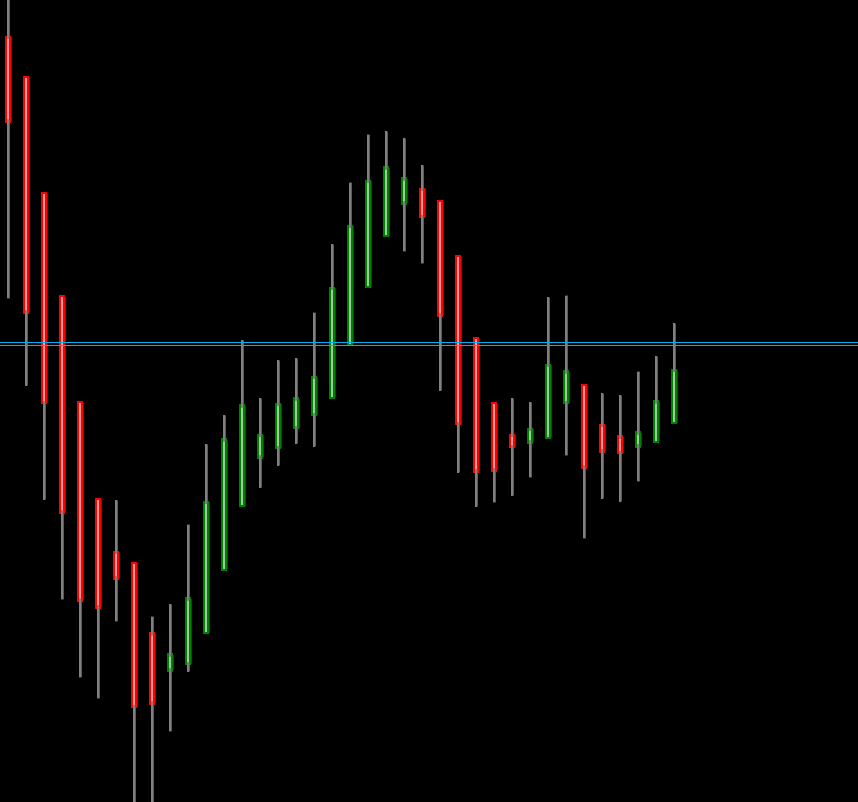
Simple MACD Histogram
03/08/2025
46
Desktop
Since 15/06/2025
Free installs
156

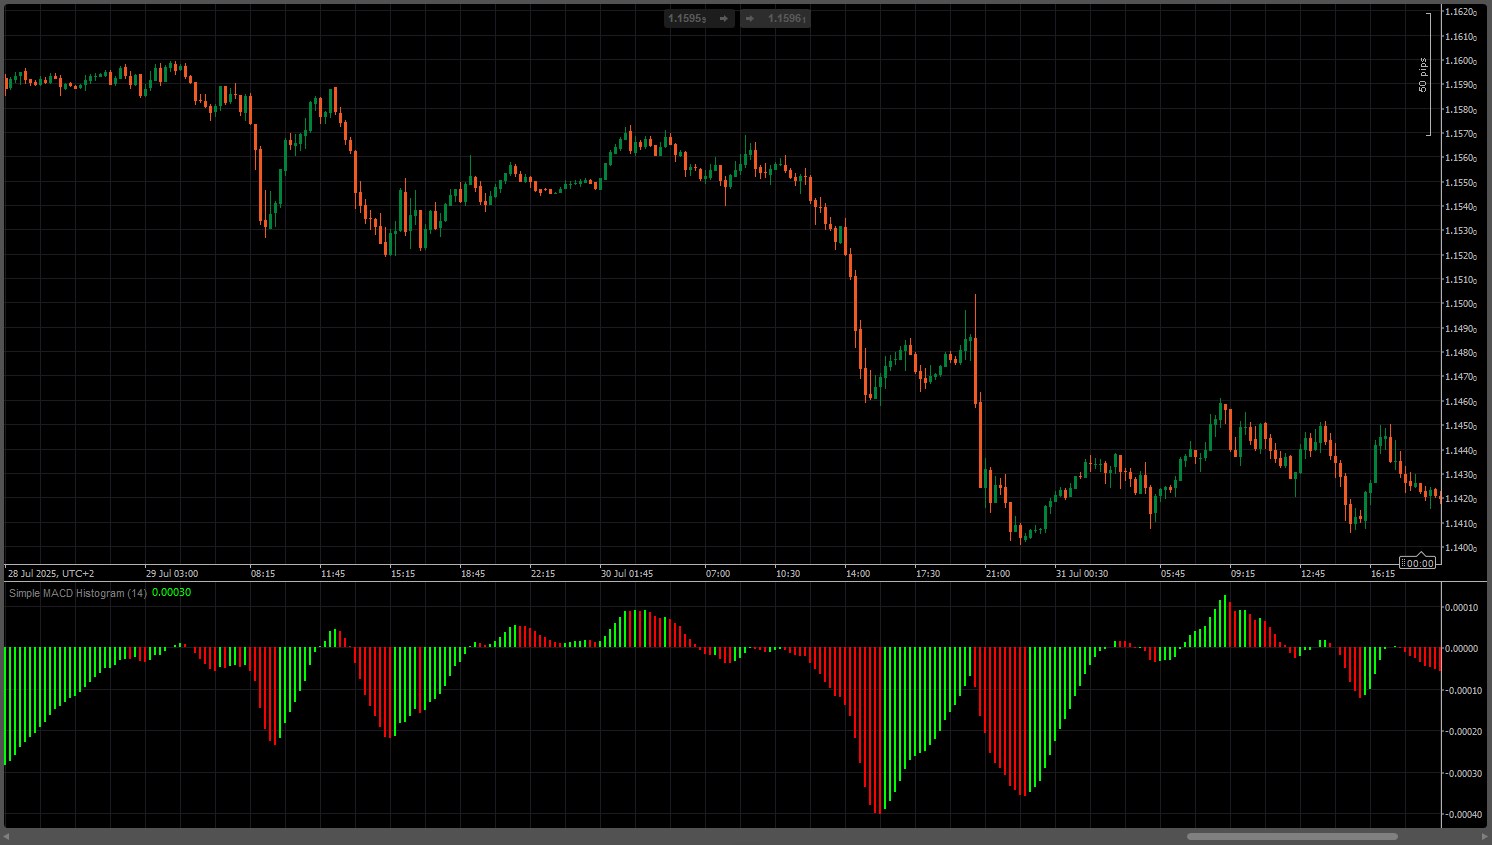
This custom MACD Histogram indicator displays the MACD histogram with enhanced visual clarity styling. The indicator uses a fast EMA period of 14, automatically calculates the slow EMA as fast plus 2 (16). The indicator features highly contrasted color-coding for instant trend recognition: bright green bars indicate rising momentum (bullish), while red bars show falling momentum (bearish). The histogram bars extend symmetrically from a center zero line, creating an intuitive visual representation where green signals buy pressure and red signals sell pressure. This visualization style provides clear, unambiguous momentum signals and helps identify potential trend reversals and momentum shifts in price action.
You may also like


Indicator
Breakout
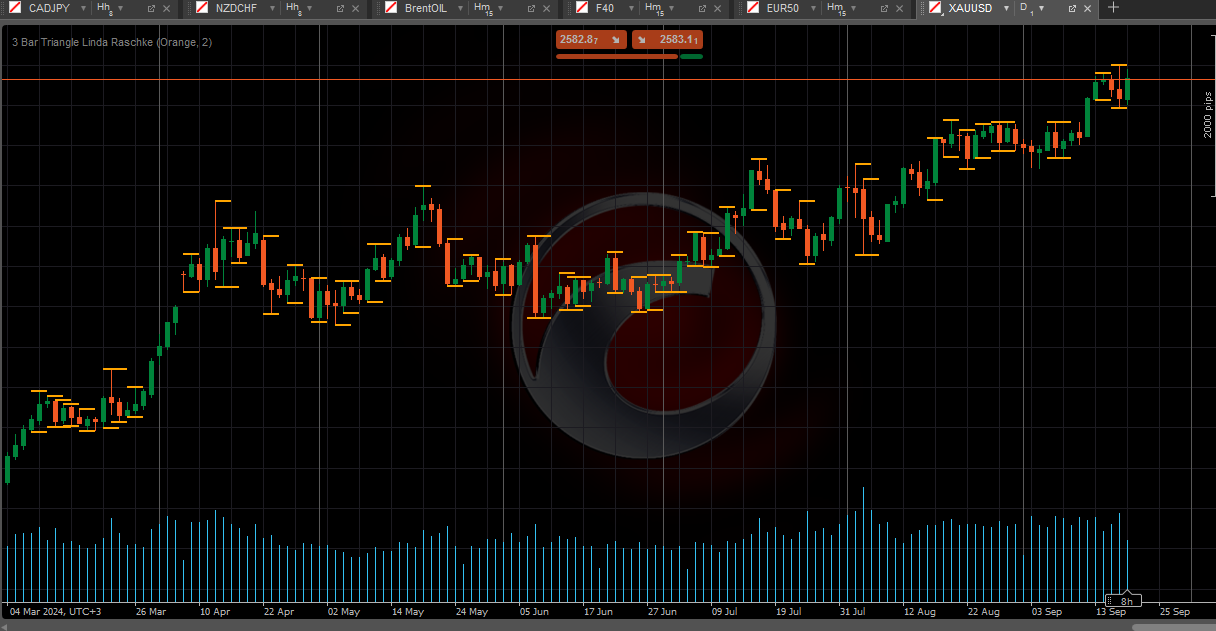
3 Bar Triangle by Linda Raschke
3 bar triangle = high below 2 day high, low above 2 day low

Indicator
Forex
VegaXLR - Candlestick Patterns Pro
Identify 34 candlestick patterns, track trends across timeframes, and get instant alerts with this powerful trading tool