
Description
**Vmm Signal Trend Pro - Indicator for cTrader**
**General Description**
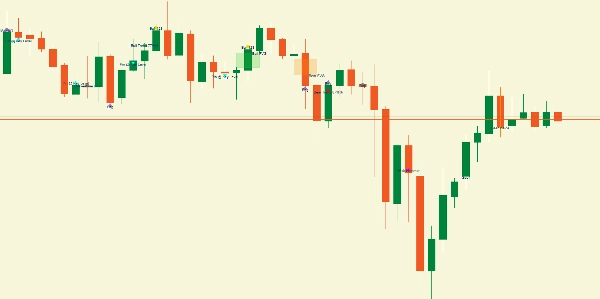
Vmm Signal Trend Pro is an advanced technical analysis indicator for the cTrader platform that detects multiple price patterns in real time. It combines trend detection, candlestick patterns, FVGs (Fair Value Gaps), gaps, and other important patterns into a single visual indicator.
**Main Features**
**1. Trend Detection**
- **Price Action Analysis**: Identifies trends through price action over the last N candles
- **Trend Strength**: Calculates percentage of strength based on momentum and structure
- **Directional Icons**: Green arrow (up) or red arrow (down) when the trend is strong
**2. Detected Patterns**
**Fair Value Gap (FVG)**
- **Bullish FVG**: When the current low > the high of 2 candles ago
- **Bearish FVG**: When the current high < the low of 2 candles ago
- **Colored Areas**: Semi-transparent rectangles (green/orange)
**Gaps**
- **Upward Gap**: Opening above the previous high
- **Downward Gap**: Opening below the previous low
- **Visualization**: Small rectangles at the candle opening
**Inside Bars**
- Candle completely within the range of the previous candle
- Differentiation by color (yellow/orange) based on direction
**123 Pattern (Reverse)**
- **Bullish 123 Pattern**: Three points with an upward breakout
- **Bearish 123 Pattern**: Three points with a downward breakout
- **Signaling**: Circular icon Gold
**Wick Patterns**
- **Hammer-like**: Significant lower Wick
- **Shooting Star-like**: Significant upper Wick
- **Icon**: Magenta Star
**Pin Bars**
- Long Wick (≥2x body) with small body
- Detection of nearby key levels
- **Icons**: Up/Down Triangle (cyan)
**Engulfing**
- **Bullish Engulfing**: Bullish candle engulfs previous bearish candle
- **Bearish Engulfing**: Bearish candle engulfs previous bullish candle
- **Icon**: Purple Diamond
**Doji**
- Very small body (≤10% of total range by default)
- Special types: Gravestone, Dragonfly, Long-Legged
- **Icon**: Gray Circle
**3.** Support/Resistance System**
- Automatic detection of swing highs/lows
- Considers proximity to key levels to increase significance
**4. Intelligent Filtering**
- **Limit by Type**: Maximum number of signals per category
- **Time Spacing**: Avoids signals that are too close together
- **Trend Filter**: Option to allow/deny counter-trend signals
- **Minimum Strength**: Filters weak signals
**Configurable Parameters**
**Essentials**
- `Show Trend Direction`: Activates trend arrows
- `Previous Bars Check`: Number of candles for analysis
- `Trend Strength Threshold`: Minimum percentage to consider a strong trend
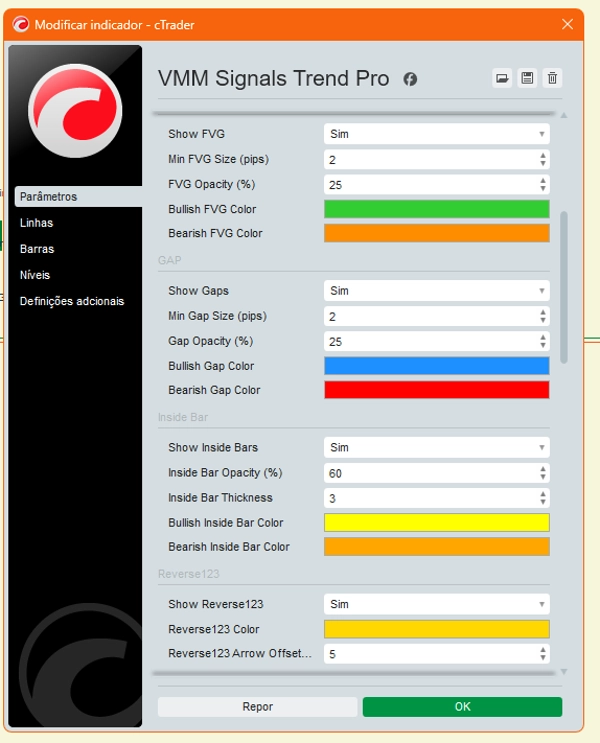
**FVG**
- `Min FVG Size`: Minimum size in pips
- `Opacity`: Transparency of areas
- `Colors`: Customizable colors
**Gaps**
- `Min Gap Size`: Minimum size in pips
- `Colors`: Colors for upward/downward gaps
**Inside Bars**
- `Thickness`: Line thickness
- Opacity: Transparency
- Colors: Differentiated colors by direction
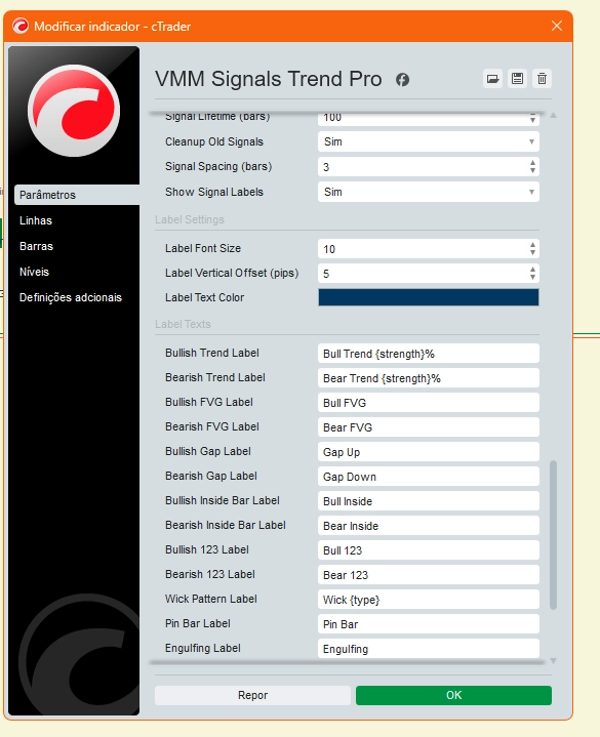
Signals:
- Signal Lifetime: Signal duration (in candles)
- Signal Spacing: Minimum spacing between signals
- Max Signals Per Type: Limit per category
Custom Labels:
- Customizable Text: Each pattern has its own configurable text
- Placeholders: `{strength}` for % strength, `{type}` for specific type
- Formatting: Font size, vertical offset, colors
- Short Mode: Abbreviated labels for dense charts
Internal Mechanics:
1. Trend Analysis:
- Linear Regression: Calculates trend slope
- Candle Count: Bullish vs. Bearish over the last N periods
- Momentum: Considers the magnitude of movements
2. Object Management**
- **Object Cache**: Prevents redrawing existing signals
- **Automatic Cleanup**: Removes old signals based on lifetime
- **Counters by Type**: Controls maximum quantity
**3. **Strength Calculation**
- Each pattern has a specific strength formula
- Based on ratios, pip distances, proximity to key levels
- Range: 0-100%
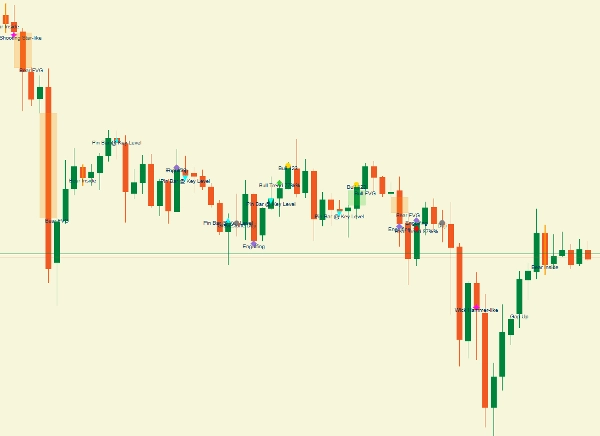
**Chart Visualization**
**Chart Elements**
1. **Icons**: Arrows, triangles, circles, diamonds, stars
2. **Areas**: Semi-transparent rectangles (FVG/Gaps)
3. **Lines**: Highlighted inside bars
4. **Labels**: Informative text next to the signals
**Color Code**
- **Green**: Bullish (trend, FVG, gaps)
- **Red/Orange**: Bearish (trend, FVG, gaps)
- **Yellow/Orange**: Inside bars (bullish/bearish)
- **Gold**: 123 pattern
- **Magenta**: Wick patterns
- **Cyan**: Pin bars
- **Purple**: Engulfing
- **Gray**: Doji
**Advantages**
**For Traders**
- **All in one**: Multiple patterns in a single indicator
- **Customizable**: Fine-tuning of each pattern
- **Clear visual**: Intuitive color coding
- **Filtering**: Prevents signal overload
**Use Cases**
**1. Quick Analysis**
- Identify prevailing trend
- Check recent FVGs and gaps
- Detect reversal patterns
**2. Entry Confirmation**
- Combine multiple patterns to increase probability
- Check alignment with trend
- Consider signal strength
**3. Risk Management**
- Identify nearby support/resistance levels
- Use FVGs as areas of interest
- Consider signal spacing
**Limitations**
**Dependencies**
- **Volatile markets**: May generate many signals
- **Timeframes**: Settings may need adjustment per timeframe
- **Assets**: Behavior varies by currency pair
**Considerations**
- **Not predictive**: Past patterns ≠ future guarantee
- **Confirmation required**: Always confirm with additional analysis
- **False signals**: Filters reduce but do not eliminate
**Usage Recommendations**
**Initial Settings**
1. Start with `Smart Filtering = true`
2. Adjust `Min Signal Strength` according to your style
3. Use `Signal Spacing` to avoid overload
4. Customize colors for better visualization
**Effective Combinations**
- **Trend + FVG**: Alignment Strong
- **Inside bar + Key level**: Good entry area
- **Pin bar + Engulfing**: Reversal confirmation
- **123 + Trend**: Probable continuation
**Monitoring**
- Check logs in the console periodically
- Adjust parameters according to the market
- Use in conjunction with other indicators
This indicator is a complete tool for traders seeking comprehensive technical analysis focused on price action and visual patterns, offering total flexibility in customizing and filtering signals.
**⚠️ IMPORTANT DISCLAIMER**
This indicator is a TECHNICAL ANALYSIS TOOL. Generated signals are SUGGESTIONS based on algorithms, NOT investment recommendations. Trading involves significant risk of loss. Past performance does not guarantee future results. The trader bears FULL RESPONSIBILITY for all trading decisions. Always use proper risk management and test on demo accounts before live trading.


