
Description
Meravith Auto is an automated version of the Meravith manual trading system.
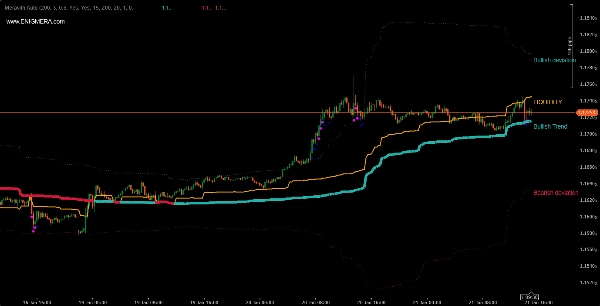
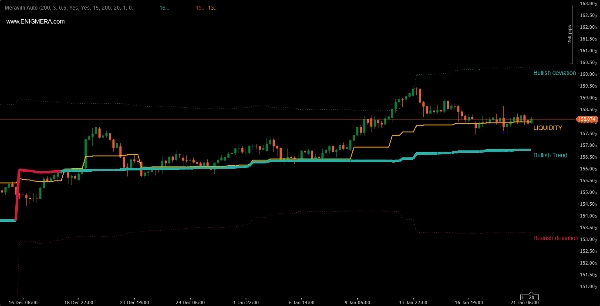
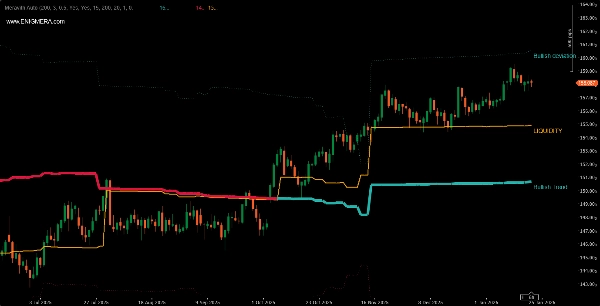
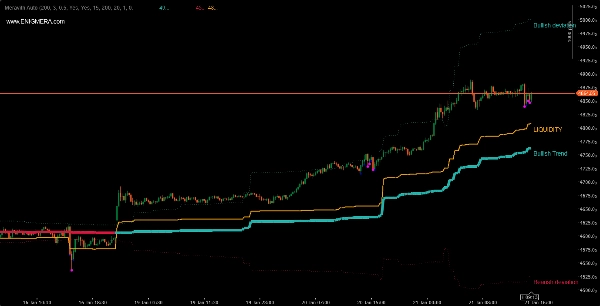
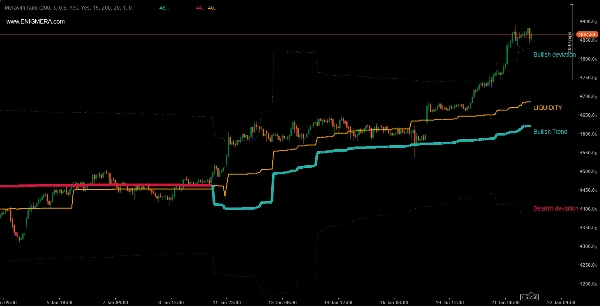
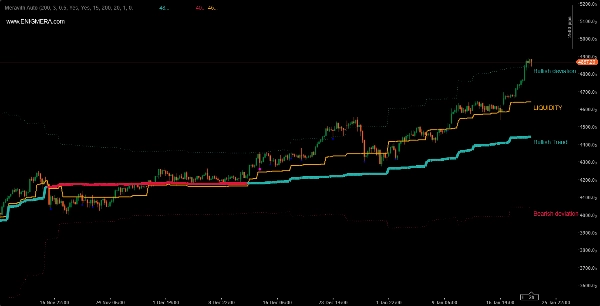
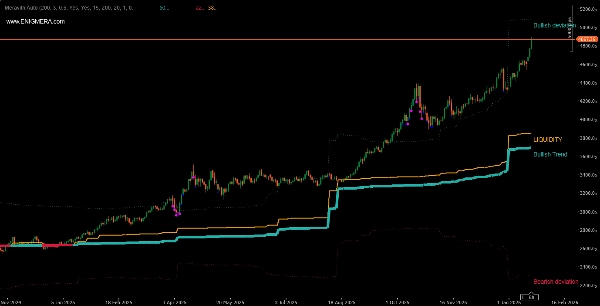
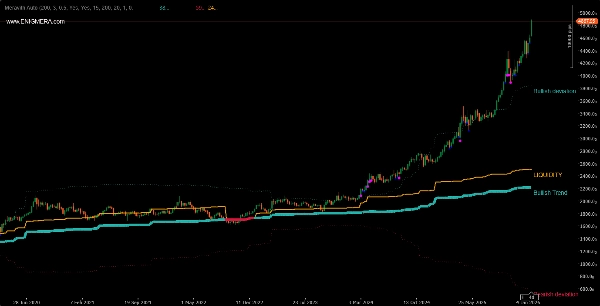
The indicator consists of:
- Trend line that changes its color. When bullish it is green, and when bearish it is red. This is the trend support line.
- Liquidity line, where bullish volume is equal to bearish volume.
- Triple bullish deviation line.
- Triple bearish deviation line.
- Purple and blue dots that indicate high volume. The purple dot indicates volume greater by two deviations from the average volume, and the blue dot two deviations.
How to use it?
- Bullish trend line plus liquidity above the trend line equals a bullish trend. We expect the market to move upward. We open long positions.
- Bearish trend line plus liquidity below the trend line equals a bearish trend. We expect the market to move downward. We open short positions.
Combine it at your discretion with other indicators.
It can be used on any pair and any timeframe.
You may see different results with different brokers due to the volume they quote.
Larger brokers are preferable due to higher volume.
What is the difference between the automated and the manual versions?
- In the manual version, we have a trend assessment based on highs and lows. Accordingly, it also provides levels of volume exhaustion in the market.
- In the automated version, we have a period that changes across different market phases. It can vary, being short during high volatility and long during low volatility. Here there are no exhaustion levels, since a trend is not analyzed, but rather a period. This is the reason we have deviations. By default, the triple deviation is displayed.
Summary
Indicator profile
Customer reviews
0.0
Reviews: 0
Customer reviews
No reviews for this product yet. Already tried it? Be the first to tell others!
Discussion
FAQ
BTCUSD
Forex
Signal
Breakout
Indices
EURUSD
Commodities
GBPUSD
NZDUSD
Prop
Scalping
Crypto
Stocks
XAUUSD
NAS100
USDJPY
VWAP
Products available through cTrader Store, including trading bots, indicators and plugins, are provided by third-party developers and made available for informational and technical access purposes only. cTrader Store is not a broker and does not provide investment advice, personal recommendations or any guarantee of future performance.


Price
Since 24/10/2025