
Description
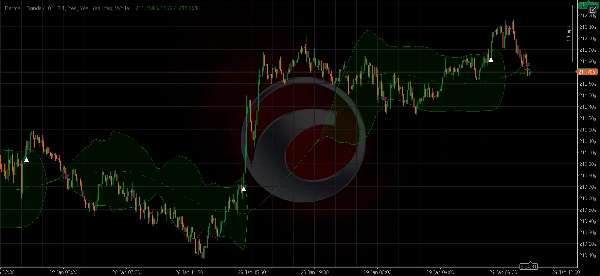
Bermaui Bands (BB) is a technical analysis tool that helps filter between ranging and trending price movements. The idea behind this indicator can be explained in the next steps -
- Calculate Standard Deviation as an oscillator that moves between 0 and 100. Will name it Bermaui Deviation percent (BD percent).
- If "BD percent" is near zero then volatility is at its extreme. In addition, if "BD percent" is near 100 then volatility is very low.
- High volatility means a great probability for a trending market, while low volatility means side-way or ranging market.
- Middle Line is a Simple Moving Average because Standard Deviation is calculated depending on Moving Average.
- Add "BD percent" to a simple moving average with the same number of bars in the calculation to get The Upper Bermaui Band.
- Subtract "BD percent" from a simple moving average with the same number of bars in the calculation to get The Lower Bermaui Bands.
Summary
Indicator profile
Customer reviews
0.0
Reviews: 0
Customer reviews
No reviews for this product yet. Already tried it? Be the first to tell others!
Discussion
FAQ
Forex
Signal
Breakout
Indices
Commodities
Crypto
Stocks
Products available through cTrader Store, including trading bots, indicators and plugins, are provided by third-party developers and made available for informational and technical access purposes only. cTrader Store is not a broker and does not provide investment advice, personal recommendations or any guarantee of future performance.


Price
Since 28/01/2026