"DailyLossGuard" logo
Indicator
Version 1.0, Mar 2026
Windows, Mac
4.6
Reviews: 3
"DailyLossGuard" uploaded image
Since 08/02/2026

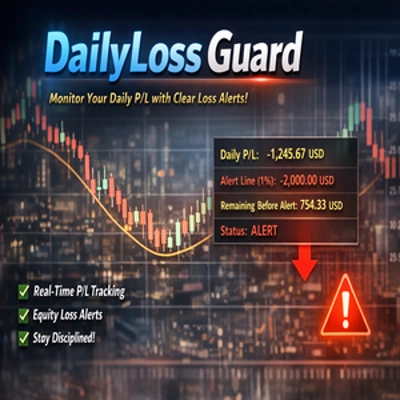
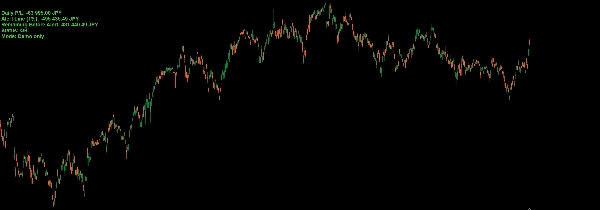
DailyLossGuard helps traders stay aware of their daily risk exposure directly on the chart.

This indicator calculates your total daily P/L by combining:

  • realized P/L from positions closed today
  • unrealized P/L from currently open positions

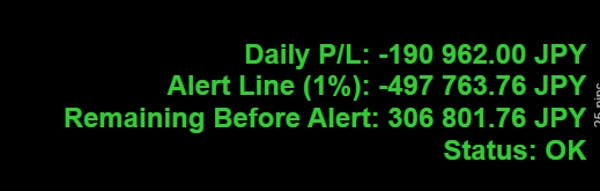
When your daily loss reaches the percentage threshold you define based on account equity, the indicator switches to a red warning display on the chart.

It also shows how much loss remains before the alert is triggered, helping you make faster and more disciplined trading decisions.

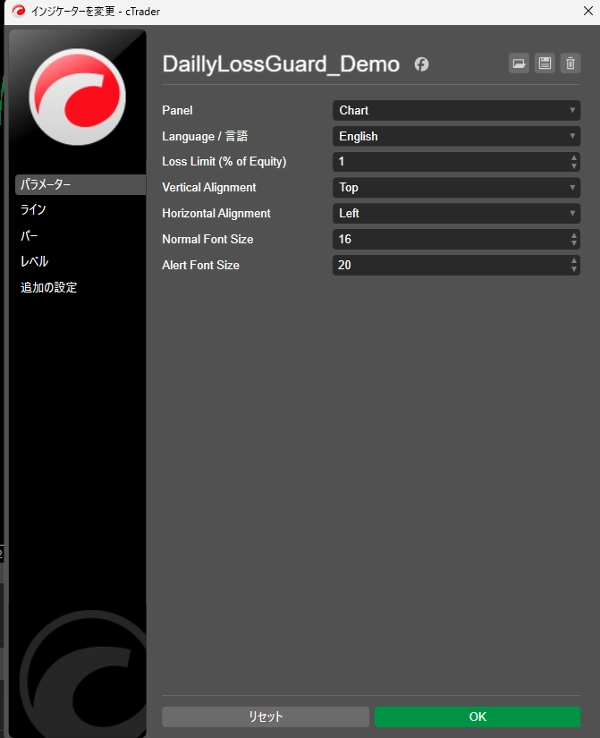
Designed for clarity and ease of use, DailyLossGuard includes bilingual display support for English and Japanese, making it suitable for both domestic and international traders.


Key Features

  • Real-time daily P/L monitoring
  • Includes both realized and unrealized P/L
  • Alert based on a user-defined percentage of account equity
  • Clear red warning text when loss threshold is reached
  • Displays remaining loss before alert
  • English / Japanese language switch
  • Easy-to-read number formatting
  • Clean on-chart display
Indicator profile
4.6
Reviews: 3
5
67 %
4
33 %
3
0 %
2
0 %
1
0 %
Customer reviews
April 1, 2026
March 29, 2026
The only reason it stays interesting is the poor entries show up earlier, and half size is enough at the start.
March 26, 2026
it is easier to trust when the workflow feels calmer, and It works better with a written plan.
BTCUSD
Signal
EURUSD
GBPUSD
NZDUSD
XAUUSD
NAS100
USDJPY
Products available through cTrader Store, including trading bots, indicators and plugins, are provided by third-party developers and made available for informational and technical access purposes only. cTrader Store is not a broker and does not provide investment advice, personal recommendations or any guarantee of future performance.

More from this author

Indicator
Grid
BTCUSD
+6
RiskLotSizer is a practical risk management indicator for cTrader that helps traders calculate lot size based on a chose

You may also like

Indicator
Key Levels
Supply & Demand
+2
Institutional Levels Pro is an essential tool for traders who rely on price action and institutional market structure.
Indicator
AI
ATR
+12
The standard Relative Strength Index (RSI), RSI & Signal Cloud, Smart Volatility Filter (ATR), On-Chart Info Dashboard
Indicator
ATR
RSI
+16
Multi-timeframe trend indicator using EMA, MACD & ADX to confirm high-probability buy and sell bias.
Indicator
Alpha Sentiment Pro - See the Market's Pulse Before It Moves
Indicator
Prop
Forex
+12
Identify and trade breakouts with Consolidation Zones! Visualize price consolidation areas for trading opportunities.
Indicator
Forex
EURUSD
+3
Forex Strength Meter for cTrader: 4 custom currencies, cross alerts, visual arrows. Trade smarter!
Indicator
MSS
Market Structure
NY HTF Candles is a precision panel designed specifically for institutional traders
Indicator
Candle Timer & Strength Panel for cTrader Description: Candle Timer & Strength Panel is an advanced, always-visible over
Indicator
SMC
Prop
+6
Automatically draws the Opening Range (High & Low) for Tokyo, London, and New York sessions. Configurable start times,
Indicator
Forex
The cTrader Market Sessions Alerts Indicator marks global sessions, highlights key levels, and sends real-time alerts.
Indicator
Forex
BTCUSD
+11
Unlock trading precision with QQE! Dual QQE indicators with a Bollinger Bands zero line provide clear buy/sell signals.
Indicator
Shows BUY & SELL signals for 3 & 4 BAR PATTERN (Morning star/ Evening star). It is adjustable and it will SHOW ARROWS.
Indicator
BOS
MSS
+5
WinSMC is an overlay SMC indicator for cTrader. It helps you visually identify!
Indicator
SMC
Prop
+14
FVG Multi Time Frame Indicator
Indicator
Forex
BTCUSD
+4
The Linear Regression Oscillator (LRO) is a technical indicator based on linear regression analysis.
Indicator
RSI
Prop
+14
Unlock Stochastic RSI PRO in cTrader! Overlay RSI, highlight zones, and identify divergences with customizable settings.
Indicator
ATR
Breakout
Detects swing highs/lows, structure, breakouts, trend lines, and fibs — great for price action trading.
Indicator
EMA
SMA
+3
MACD indicator modeled after TradingView, featuring a 4-color momentum histogram, sound/pop-up crossover alerts.
Since 08/02/2026