Description
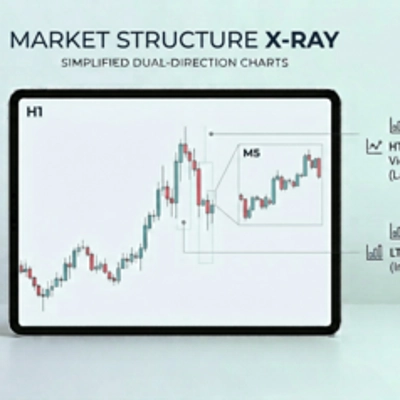
Market Structure X-Ray
See the Full Market Structure Without Switching Timeframes
Most traders don’t lose because their strategy is wrong.
They lose because they are trading with incomplete information.
You check higher timeframe bias, switch to a lower timeframe for entry, and lose context.
You see candles forming, but you don’t see what’s happening inside them.
You enter trades that look clean, only to get invalidated by structure you didn’t fully see.
You’re not wrong. You’re just not seeing the full picture.
What This Tool Does
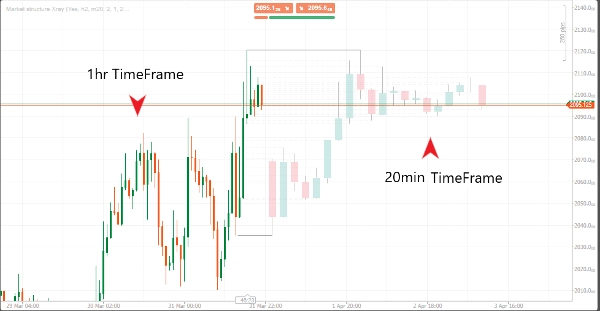
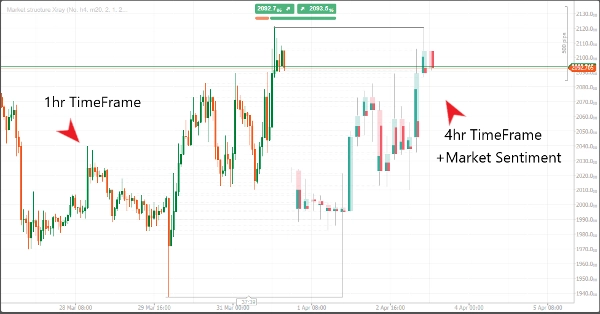
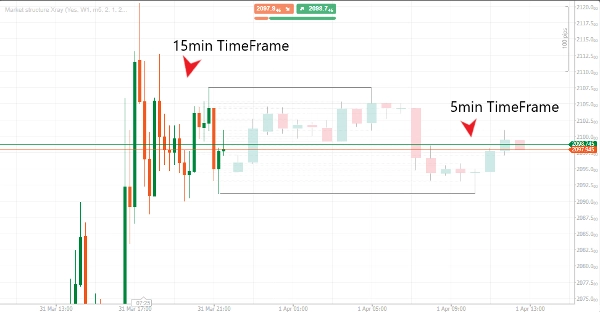
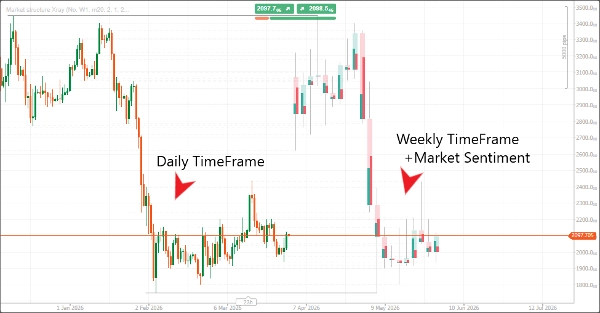
Market Structure X-Ray gives you true multi-timeframe visibility directly inside a single chart.
- Project higher timeframe candles onto your current chart
- Compress lower timeframe activity into higher timeframe structure
- Reveal internal bullish and bearish sentiment inside each candle
No switching. No guessing. No blind execution.
What This Changes
- Execute on lower timeframes with higher timeframe confirmation
- Identify weak moves before they fail
- Understand how each candle is formed internally
- Make faster, more confident trading decisions
Core Features
Higher Timeframe Projection
View higher timeframe candles forming directly on your current chart.
Stay aligned with structure without leaving your execution timeframe.
Lower Timeframe Compression
See how lower timeframe price action builds each higher timeframe candle.
Understand the real story behind every move.
Internal Sentiment Visualization
Each candle shows the balance between bullish and bearish pressure.
Not just open and close — but what happened inside.
Forward Projection Display
Projected candles are displayed ahead of current price, allowing you to plan and anticipate structure.
Clean Visual Design
Minimal overlays designed to enhance clarity without cluttering your chart.
Who This Is For
- Traders using ICT or SMC concepts
- Scalpers who need higher timeframe bias
- Intraday traders tired of switching between charts
- Traders focused on structure, not signals
Who This Is Not For
- Beginners looking for automated buy/sell signals
- Traders who do not understand market structure
- Anyone expecting a fully automated system
What You Get
- Market Structure X-Ray Indicator
- Trade Clarity Playbook
- Chart Setup Templates
- Execution Model Guide
- Lifetime updates
Final Perspective
You do not need more indicators.
You need better visibility into price.
This tool gives you the ability to see structure across timeframes in a way most traders cannot.
That difference is what separates random execution from controlled decision-making.
Summary
Customer reviews
5 | 0 % | |
4 | 100 % | |
3 | 0 % | |
2 | 0 % | |
1 | 0 % |