
Description
Looking at the full indicator, let me write both the short description and the full store listing.
Short Description (120 chars)
HTF Bias Detector: panel candles, CRT/Expansion/Swing Point patterns, PSP & SMT divergence — all in one overlay.
Full cTrader Store Description
HTF Bias Detector — Panel Edition
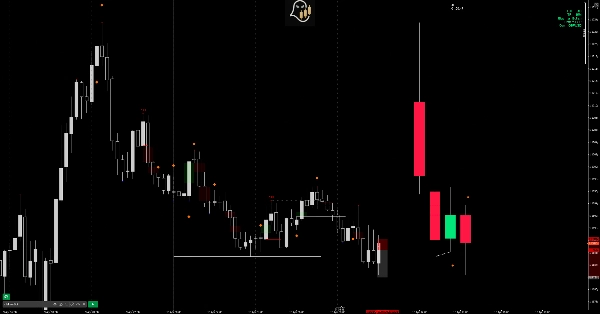
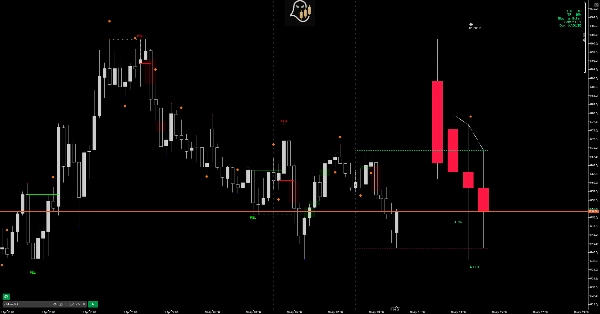
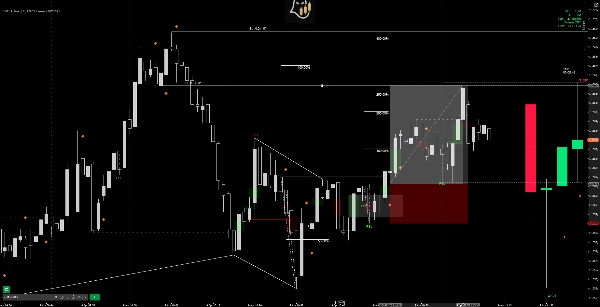
HTF Bias Detector brings your entire top-down analysis workflow into a single overlay indicator. Instead of switching between timeframes, it draws a floating panel of Higher Timeframe (HTF) candles directly to the right of price on your current chart, then automatically detects your key bias patterns, correlated pair divergences, and Smart Money Technique signals — all without leaving the screen.
How the Panel Works
The indicator automatically determines the correct HTF based on whatever chart you are on, following standard timeframe alignment used in institutional and Smart Money trading:
Your ChartHTF Panel
1M / 2M / 3M / 4M - 15M
5M / 10M - 1H
15M / 30M - 4H
1H - Daily
4H - Weekly
Daily - Monthly
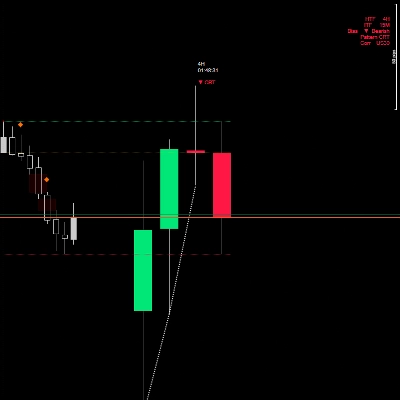
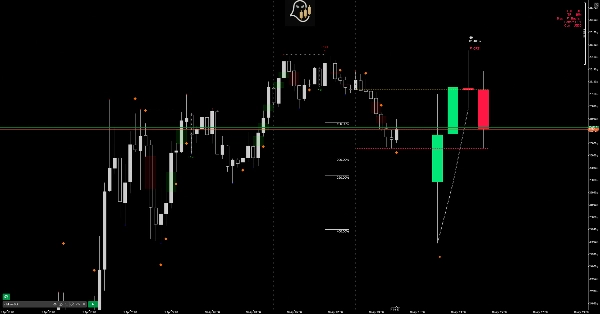
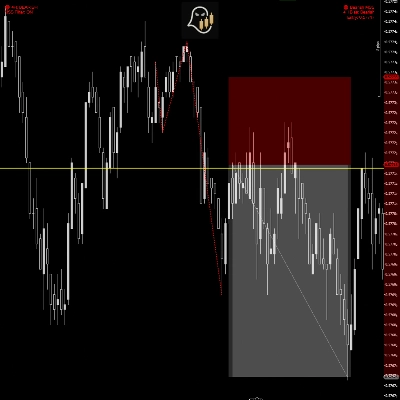
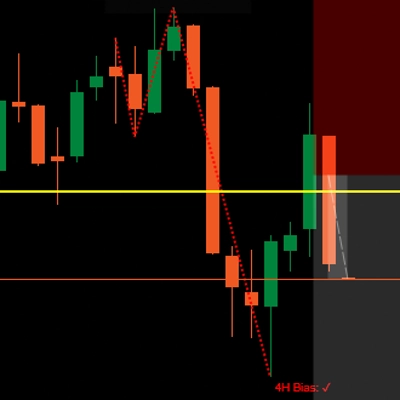
The panel draws N configurable HTF candles (default 6) to the right of the last bar, complete with a background box, wicks centred on each candle body, and vertical dotted separators on the live chart marking each HTF open. A countdown timer above the panel shows the time remaining in the current HTF candle, and dashed OHLC projection lines extend from the forming HTF candle back to the live price area so you always know where the current HTF open, high, low, and close sit.
Bias Pattern Detection
The indicator scans the visible HTF panel candles for three core institutional bias patterns and labels each detected signal directly on the panel:
CRT — Candle Range Theory Formed by two candles. C1 sets the range. C2 sweeps C1's low (bullish) or high (bearish) but closes back inside the range without taking the opposite extreme. Signals a liquidity grab and expansion in the opposite direction. C3 and C4 are the expected expansion candles.
Expansion Formed by two candles. C2 sweeps C1's low then closes above C1's high (bullish), or sweeps C1's high then closes below C1's low (bearish). A single-candle full-range expansion showing overwhelming directional pressure. C3 and C4 are anticipated continuation candles.
Swing Point (Protected) Formed by three candles. C1 sets direction. C2 breaks and closes beyond C1's extreme — trapping breakout traders. C3 fully reclaims C2's range by closing above C2's open (bullish) or below C2's open (bearish), protecting the swing and signalling reversal. C4 is the expected continuation.
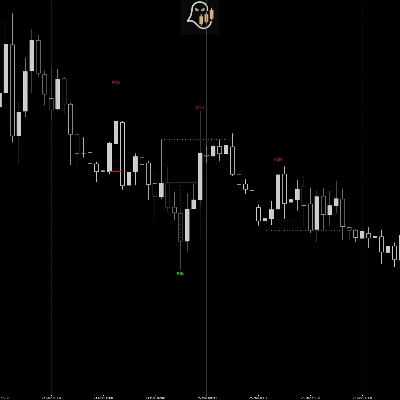
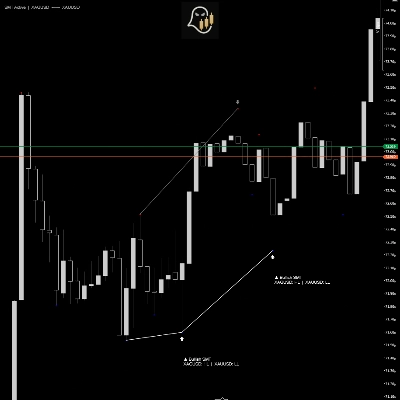
Each detected pattern is labelled with a directional arrow and pattern name directly on the signal candle in the panel (e.g. ▲ CRT, ▼ Expansion, ▲ Swing Point). The colour-map system ensures that when multiple patterns overlap on the same candles, the most recent pattern always wins — preventing stale colours from earlier signals contaminating newer ones.
PSP — Precision Swing Point
PSP is detected at two levels simultaneously:
HTF Panel PSP — compares each HTF panel candle of your chart symbol against the corresponding candle of the correlated pair at the same timeframe. When the two pairs close in opposite directions on the same HTF candle, an orange ◆ diamond appears above or below that panel candle, offset just beyond the pattern label so both signals remain readable without overlapping.
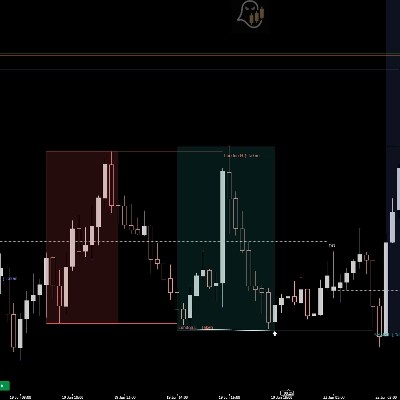
ITF Chart PSP — scans the last 200 bars of the current chart timeframe and places an orange ◆ diamond icon directly on each bar where your symbol and its correlated pair closed in opposite directions. A configurable doji filter (default 10% body-to-range ratio) prevents weak indecision candles from generating false PSP signals.
SMT — Smart Money Technique Divergence
SMT divergence is detected at two levels:
HTF Panel SMT — compares consecutive HTF panel candle highs and lows between your chart symbol (pair A) and the correlated pair (pair B). When pair A makes a lower low while pair B makes a higher low (bullish SMT), or pair A makes a higher high while pair B makes a lower high (bearish SMT), two lines are drawn directly in the panel connecting the divergent price levels.
The line style communicates which side of the divergence your current chart represents: a solid line marks the swept/fake side, and a dotted line marks the strong/protected side. Because the detection is symmetric, the signal appears on both the GBPUSD and EURUSD charts (for example) simultaneously — with the solid and dotted lines swapping depending on which pair you are viewing.
Correlated Pair Auto-Detection
The indicator automatically resolves the correlated pair from the chart symbol using a comprehensive pair map covering forex majors, metals, indices, and crypto. No manual configuration is required for the pairs you trade most:
Symbol Auto Pair
GBPUSD-EURUSD
AUDUSD-NZDUSD
GBPJPY-EURJPY
XAUUSD-XAGUSD
NAS100-US30
US500-NAS100
BTCUSD-ETHUSD
The resolver normalises symbol names (removing separators like /, -, _) and strips common broker suffixes (e.g. GBPUSDm, GBPUSD.r, GBPUSD_SB) before lookup. A Manual Symbol Override parameter lets you specify any custom correlated pair, and an Auto-Detect toggle lets you disable automatic resolution entirely.
Dashboard
A compact corner dashboard (configurable to any corner) shows:
- HTF — the timeframe of the panel candles
- ITF — your current chart timeframe
- Bias — ▲ Bullish / ▼ Bearish / ── Neutral based on the most recent detected pattern
- Pattern — the specific pattern name (CRT, Expansion, Swing Point, PSP)
- Corr — the resolved correlated symbol
The dashboard text colour matches the bias direction — green for bullish, red for bearish, grey for neutral.
Safe Drawing — Your Lines Are Never Deleted
All indicator objects use dedicated internal prefixes. Only the indicator's own objects are removed on each redraw. Your manually drawn trend lines, rectangles, Fibonacci levels, and any other drawing tool objects are completely untouched.
Parameter Groups
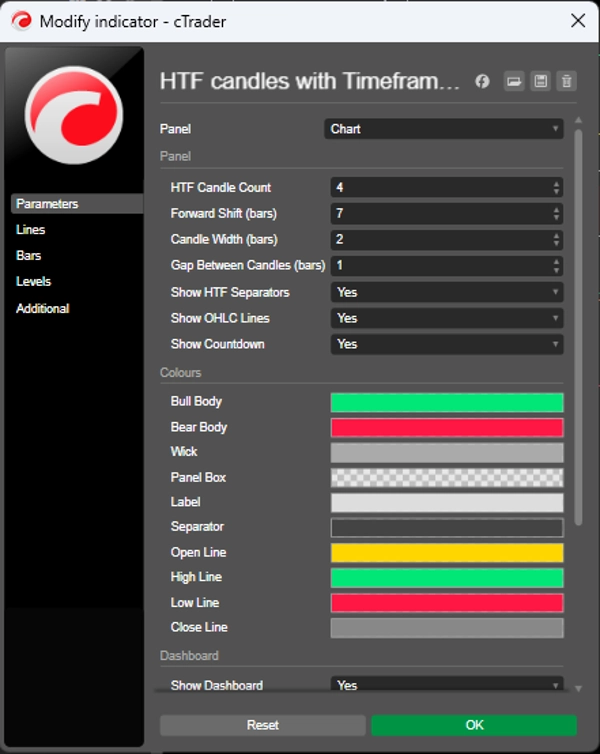
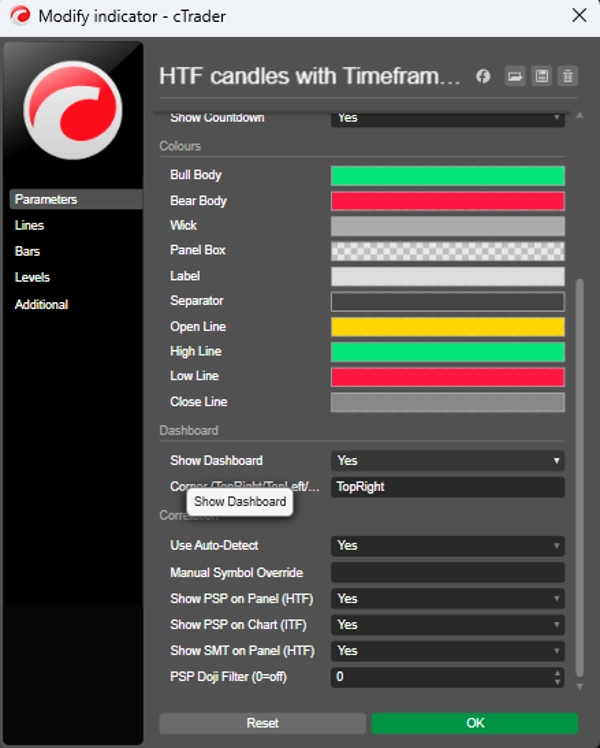
Panel — candle count, forward shift, candle width, gap, separators, OHLC lines, countdown timer
Colours — bull body, bear body, wick, panel box, label, separator, open/high/low/close line colours
Dashboard — show toggle, corner position
Correlation — auto-detect toggle, manual symbol override, PSP panel toggle, PSP chart toggle, HTF SMT toggle, PSP doji filter
ITF SMT — show toggle, swing lookback, minimum bars between swings, bearish/bullish toggles, line thickness, label toggle

















!["Smart Money Concepts (SMC) [Iridio Capital]" logo](https://cdn.ctrader.com/image/webp/b4b5414d-a5ca-44b7-a947-e28eca44a218_61548)
