present
Sign up and get $50 off your first purchase
Trading product for FixedRangeVolumeProfile_Full_20260920 Indicator Volume, image 1
FixedRangeVolumeProfile_Full_20260920
Indicator
Version 1.0, Sep 2026
Windows, Mac
Trading product for FixedRangeVolumeProfile_Full_20260920 Indicator Volume, image 2
Trading product for FixedRangeVolumeProfile_Full_20260920 Indicator Volume, image 3
Trading product for FixedRangeVolumeProfile_Full_20260920 Indicator Volume, image 4
Trading product for FixedRangeVolumeProfile_Full_20260920 Indicator Volume, image 5
Since 16/09/2026

Description

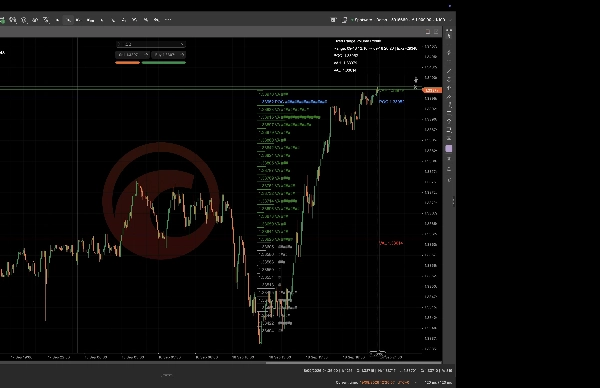
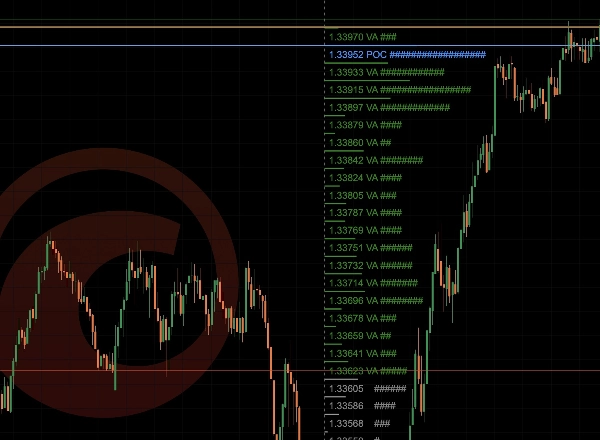
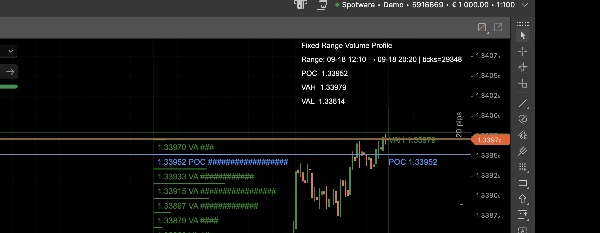
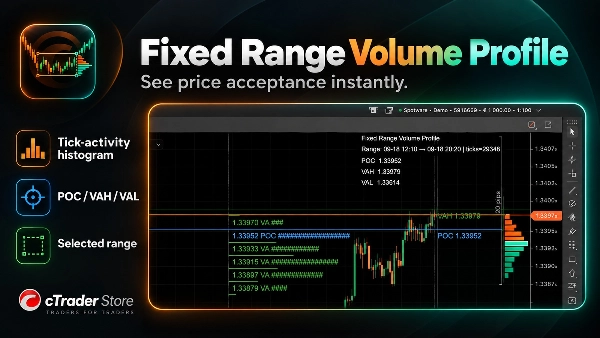
  1. Fixed Range Volume Profile adds an interactive start and end handle to a cTrader chart and calculates a tick-activity profile for the selected range. Read the Point of Control (POC), Value Area High (VAH) and Value Area Low (VAL) directly on the chart. Row count and value-area percentage are configurable in the Full version. This is a tick-activity and tick-volume proxy, not centralized exchange volume. Use it for discretionary chart analysis; results depend on the selected symbol, timeframe, range, parameters, and available history. It does not place orders or guarantee outcomes.

Summary

Indicator profile

Customer reviews

0.0
Reviews: 0
Customer reviews
No reviews for this product yet. Already tried it? Be the first to tell others!

Discussion

FAQ

Volume
Products available through cTrader Store, including trading bots, indicators and plugins, are provided by third-party developers and made available for informational and technical access purposes only. cTrader Store is not a broker and does not provide investment advice, personal recommendations or any guarantee of future performance.

More from this author

Indicator
BOS
MSS
+4
See confirmed BOS, CHOCH and SWEEP structure events on your cTrader chart.
Indicator
BOS
Add standard-timeframe context candles to a native Renko chart.
Indicator
EMA
Volume
Map range high, mid, low, price location and a deterministic pressure proxy on your cTrader chart.
Indicator
Channel
Key Levels
+1
Monitor a selected chart trendline and confirm breaks on candle close.
Desktop plugin
Trade Journal
Trade Statistics
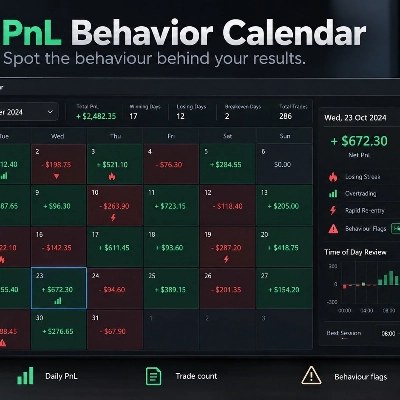
See not only what you made or lost, but which trading behaviours caused the damage.
Desktop plugin
Chart UI Tools
Keep lines, zones and channels synced across selected same-symbol charts from one desktop plugin.

You may also like

Indicator
BOS
Add standard-timeframe context candles to a native Renko chart.
Indicator
ADX
ATR
+5
Range-filter BUY/SELL flips with an ATR or swing stop, three targets, five confluence stars and a live panel
Indicator
SMC
Forex
+7
Simple Smart Money Concepts (SMC)
Indicator
AI
RSI
+18
Session boxes with UTC offset, OR logic, adjustable opacity, and multi-day lookback.
Indicator
Indices
Breakout
+1
You can use the cTrader Pivot Points Pro indicator to find a good pullback entry in a trend
Indicator
Volume
Imbalance
+1
Volume profile indicator that auto-detects the latest trendline. Shows POC, Value Area (VAH/VAL), and High Volume Nodes
Indicator
VWAP
Volume
+5
Multi VWAP. Three timeframes. One clean chart. Your Essential Trading Tool.
Indicator
Key Levels
Market Structure
+1
HTF Candle Projector displays the current Higher Timeframe candle (4H or 1H) as a real projected candle LIVE..
Indicator
ZigZag Pro – Multi-Swing Indicator for cTrader Description: ZigZag Pro is a powerful and fully customizable swing indica
Indicator
Volume
Order Block
+4
Advanced Pro Volume Profile: Double Back-to-Back, Institutional Dynamic, Fixed Range & Order Flow
Indicator
ATR
RSI
+1
Super Trend Rsi ,ATR + trend change distance + dynamic Alpha, divergence/convergence
Indicator
Prop
Forex
+14
🚀See the market’s framework, decide faster. Session-Aware Pivots. Auto Presets. Pro-Grade Zones.🚀
Indicator
Forex
BTCUSD
+11
Visualize trends with Standard Deviation Channel! Display median, and add customizable upper/lower deviation channels.
Indicator
Forex
The cTrader Market Sessions Alerts Indicator marks global sessions, highlights key levels, and sends real-time alerts.
Indicator
AI
ATR
+27
Supertrend Indicator
Indicator
ATR
RSI
+19
Multi-timeframe heatmap scoring Direction, Strength & Volatility at a glance!
Indicator
RSI
MACD
+7
The ZigZag indicator is a technical analysis tool primarily used to identify key price reversal points.
Indicator
RSI
Breakout
+1
"Identify key market zones and visualize support/resistance from multiple timeframes on a single chart.

Price

Since 16/09/2026