present
Sign up and get $50 off your first purchase
Trading product for Range Pressure Map Indicator EMA Volume, image 1
Range Pressure Map
Indicator
Version 1.0, Sep 2026
Windows, Mac
Trading product for Range Pressure Map Indicator EMA Volume, image 2
Trading product for Range Pressure Map Indicator EMA Volume, image 3
Trading product for Range Pressure Map Indicator EMA Volume, image 4
Trading product for Range Pressure Map Indicator EMA Volume, image 5
Since 16/09/2026

Description

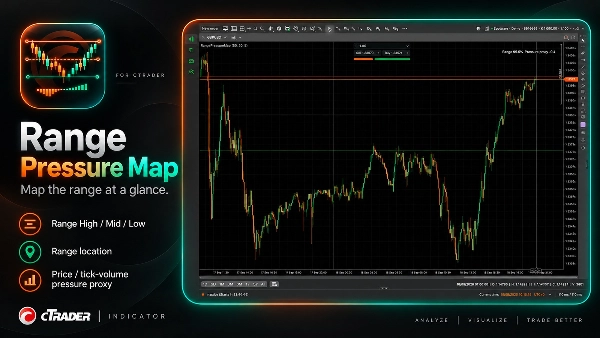
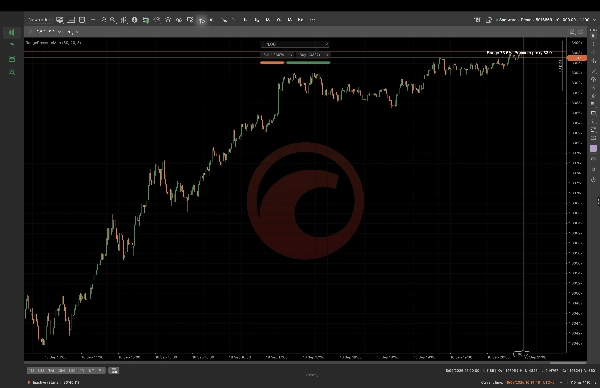
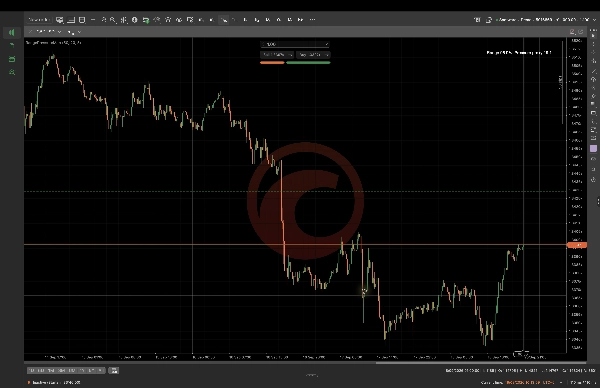
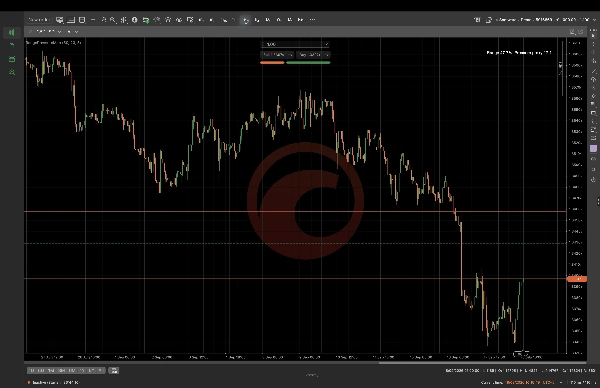
Range Pressure Map calculates a lookback range and displays Range High, Range Mid and Range Low together with the current price location and a deterministic tick-volume pressure proxy. Configure range lookback, pressure lookback and EMA length to match the chart context you are reviewing. It is designed for discretionary chart analysis and does not represent order flow, real market volume, buyer or seller activity, predictions, or automatic trade execution. Values depend on the selected symbol, timeframe, parameters, and available data.

Summary

Indicator profile
Indicator category
Support & resistance
Output type
Visualisation
Data requirements
Bars only

Customer reviews

0.0
Reviews: 0
Customer reviews
No reviews for this product yet. Already tried it? Be the first to tell others!

Discussion

FAQ

EMA
Volume
Products available through cTrader Store, including trading bots, indicators and plugins, are provided by third-party developers and made available for informational and technical access purposes only. cTrader Store is not a broker and does not provide investment advice, personal recommendations or any guarantee of future performance.

More from this author

Indicator
BOS
MSS
+4
See confirmed BOS, CHOCH and SWEEP structure events on your cTrader chart.
Indicator
BOS
Add standard-timeframe context candles to a native Renko chart.
Indicator
Channel
Key Levels
+1
Monitor a selected chart trendline and confirm breaks on candle close.
Desktop plugin
Trade Journal
Trade Statistics
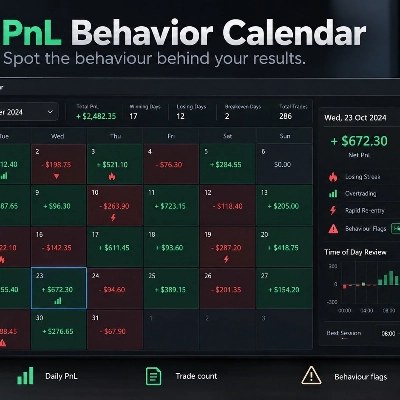
See not only what you made or lost, but which trading behaviours caused the damage.
Desktop plugin
Chart UI Tools
Keep lines, zones and channels synced across selected same-symbol charts from one desktop plugin.

You may also like

Indicator
AI
RSI
+7
Multi-asset screener with real-time RSI/volatility analysis, interactive dashboard, and color-coded trading signals.
Indicator
Key Levels
Order Block
+5
Order blocks, fair value gaps, liquidity sweeps and a 24-timeframe signal scanner on one chart.
Indicator
Forex
Crypto
+5
🚀 Automated Elliott Wave & Fibonacci tool for cTrader. Spot trends, corrections & retracements fast.
Indicator
ADX
ATR
+5
Ten confluence layers scored on every closed bar, with an anti-chop gate, pivot levels and a live dashboard.
Indicator
ATR
RSI
+5
Gold Emperor: AI-driven XAUUSD dominance. Dynamic pivots, matrix trend logic, and institutional shield protection.
Indicator
ATR
Volume
+3
Fibonacci trend signals on closed bars, with an ATR stop, up to four targets and a break-even ladder.
Indicator
Volume
Custom range volume profile between two draggable anchors. Auto source timeframe, Total/Up-Down/Delta, POC, Value Area.
Indicator
SMC
Prop
+7
institutional-level market analysis
Indicator
cTreder Smart SMA
Indicator
BOS
VWAP
+4
Gold premiun XAUUSD Exclusive Real-Time Adaptive Intelligence
Indicator
RSI
Forex
+12
Indicator pattern signal moment
Indicator
ADX
ATR
+5
EMA-cross signals scored on six confluence layers, with an ATR stop, three targets and a live panel
Indicator
ATR
RSI
+5
Multi-factor VWAP mean-reversion signals with ATR bands, volume exhaustion, and RSI gate on cTrader.
Indicator
AI
ATR
+23
The ZigZag Trend is a market structure tool that filters out small price fluctuations and highlights major swing.
Indicator
ATR
Prop
+6
🟢 Strength-ranked S/R zones with MTF levels and Pro labels. Nearest-zone band and HUD for faster, cleaner entries. 🔴
Indicator
Risk Dashboard
AI-powered daily range forecasts help traders spot volatility opportunities and plan stops and targets.
Indicator
BOS
CHOCH
+4
Dual-track market structure detection with BVC order flow confirmation and two-stage liquidity sweep validation.
Indicator
AI
ATR
+27
Deep Mood Distribution (DMD) is a segmented volume-profile and sentiment tool that analyzes price action in fixed bar bl

Price

Since 16/09/2026