present
Sign up and get $50 off your first purchase
Trading product for BOS CHOCH Structure Indicator Key Levels MSS, image 1
BOS CHOCH Structure
Indicator
Version 1.0, Sep 2026
Windows, Mac
4.5
Reviews: 4
Trading product for BOS CHOCH Structure Indicator Key Levels MSS, image 2
Trading product for BOS CHOCH Structure Indicator Key Levels MSS, image 3
Trading product for BOS CHOCH Structure Indicator Key Levels MSS, image 4
Trading product for BOS CHOCH Structure Indicator Key Levels MSS, image 5
Trading product for BOS CHOCH Structure Indicator Key Levels MSS, image 6
Trading product for BOS CHOCH Structure Indicator Key Levels MSS, image 7
Trading product for BOS CHOCH Structure Indicator Key Levels MSS, image 8
Trading product for BOS CHOCH Structure Indicator Key Levels MSS, image 9
Since 16/09/2026

Description

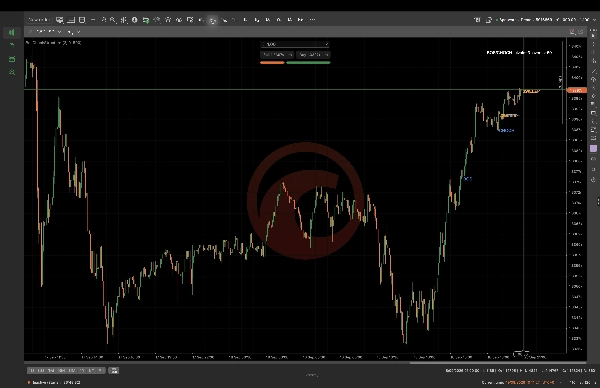
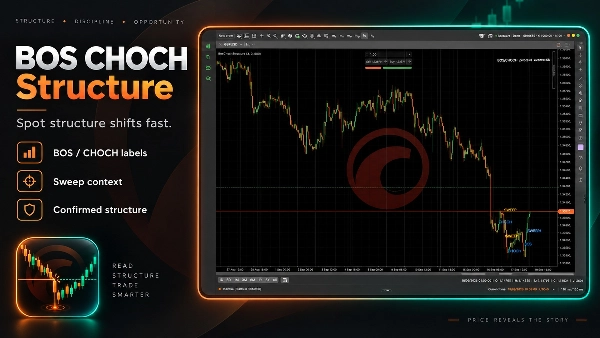
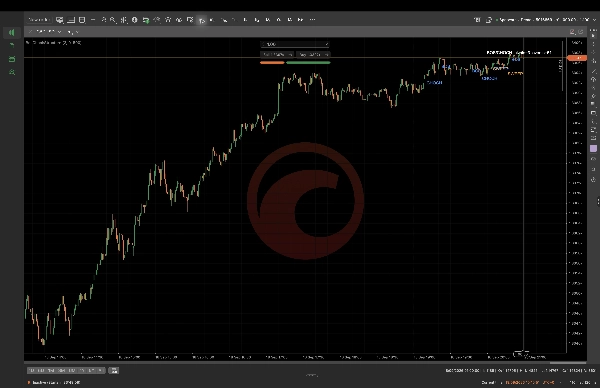
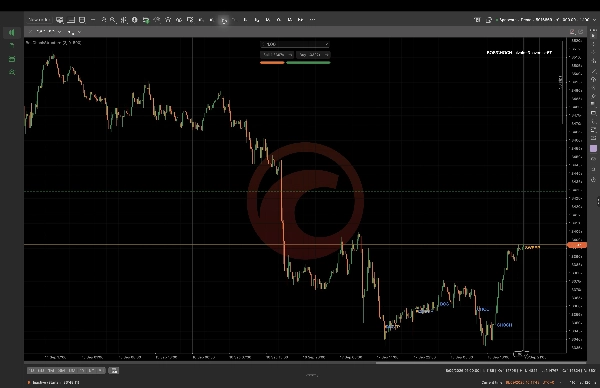
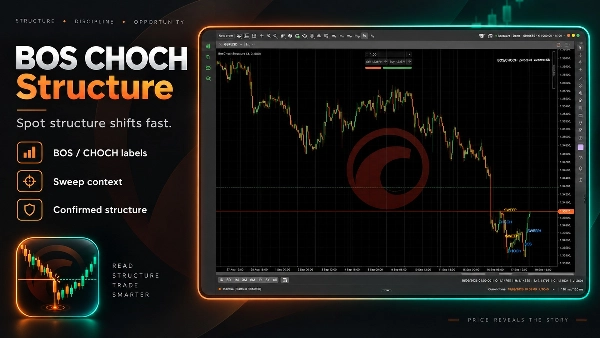
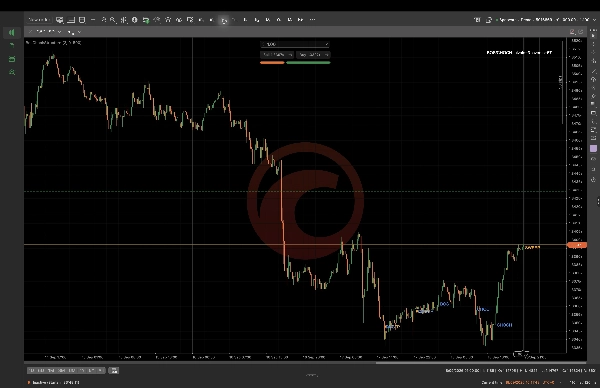
BOS CHOCH Structure is a cTrader indicator for reading confirmed market structure on price charts. It analyses OHLC bars and confirmed pivots, then marks Break of Structure (BOS), Change of Character (CHOCH), and wick Sweep events as on-chart visual annotations. Use pivot strength, break buffer, and history depth to tune the view for your preferred instruments and periods. It is intended for discretionary chart analysis on forex and index markets, including intraday and higher-timeframe review. Labels are confirmation aids, not predictions or automatic trade execution. Signals depend on completed-bar data and the selected parameters; this indicator does not place orders or guarantee outcomes.

Summary

AI summary
BOS CHOCH Structure is a cTrader indicator designed to identify and display confirmed market structure events directly on price charts. It analyzes OHLC bars and confirmed pivot points to visually mark Break of Structure (BOS), Change of Character (CHOCH), and wick Sweep events as on-chart annotations. Users can adjust parameters such as pivot strength, break buffer, and history depth to customize the indicator’s sensitivity for various instruments and timeframes. The tool supports discretionary analysis primarily for forex and index markets, suitable for both intraday and higher timeframe reviews. It provides confirmation aids based on completed-bar data but does not generate predictive signals or execute trades automatically. This indicator focuses on visualizing key market structure shifts and liquidity grabs to assist traders in their chart analysis.
Indicator profile
Indicator category
Market structure (SMC)
Output type
Visualisation
Data requirements
Bars only
Supported signals
Breakout
Reversal

Discussion

Customer reviews

4.5
Reviews: 4
5
50 %
4
50 %
3
0 %
2
0 %
1
0 %
Customer reviews
October 26, 2026
Confirmed pivots, completed candles and an adjustable break buffer give the BOS, CHoCH and wick sweep labels a clear, inspectable basis rather than an undefined notion of market structure.
October 20, 2026
Wick sweeps beside confirmed structure give the chart some welcome nuance. Pivot strength and the break buffer define what is significant. The overlay has clear rules to inspect rather than another unexplained claim to know the next break.
October 14, 2026
The break buffer and pivot strength let the meaning of structure be adjusted openly. BOS and CHoCH follow completed candles and confirmed pivots. That makes the markings fairly transparent instead of hiding their sensitivity behind a label.
October 12, 2026
Confirmed pivots and completed bars give the BOS and CHoCH labels a reasonably clear foundation. Pivot strength and the break buffer expose sensitivity, with wick sweeps recorded as structural events rather than forecasts of the next move.

FAQ

Key Levels
MSS
BOS
CHOCH
Market Structure
Liquidity Grab
Products available through cTrader Store, including trading bots, indicators and plugins, are provided by third-party developers and made available for informational and technical access purposes only. cTrader Store is not a broker and does not provide investment advice, personal recommendations or any guarantee of future performance.

More from this author

Indicator
BOS
Add standard-timeframe context candles to a native Renko chart.
Indicator
EMA
Volume
Map range high, mid, low, price location and a deterministic pressure proxy on your cTrader chart.
Indicator
Channel
Key Levels
+1
Monitor a selected chart trendline and confirm breaks on candle close.
Desktop plugin
Trade Journal
Trade Statistics
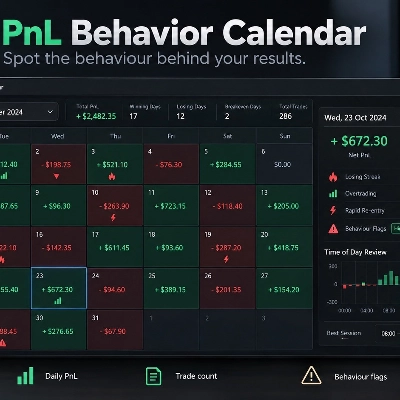
Review daily PnL, trade counts, losing streaks and rapid re-entry from your cTrader history.
Desktop plugin
Chart UI Tools
Keep lines, zones and channels synced across selected same-symbol charts from one desktop plugin.
cBot
Drawdown Guard
Daily Loss Limit
Monitor account-wide loss and stop-loss risk budgets, with optional order cancellation and post-fill closure.
Desktop plugin
Position Sizer
Risk Calculator
Size manual trades from your risk settings and review Market, Limit or Stop orders before execution.
Indicator
Volume
Key Levels
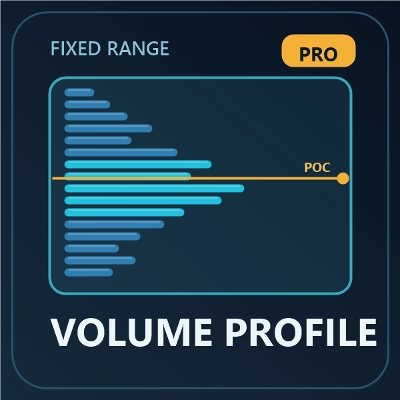
View tick activity across a selected chart range with Point of Control, Value Area High and Value Area Low.

You may also like

Indicator
RSI
VegaXLR's cTrader StochRSI identifies overbought/oversold RSI levels for precise trade entries.
Indicator
Signal
Dark Poll Signal Indicator.liquidity leakage,precedes the great movement, accumulation, distribution
Indicator
ADX
ATR
+5
Precision Sniper by PrimeQuant: Advanced confluence engine with auto-presets, dynamic TP/SL, and live backtest stats.
Indicator
Key Levels
Market Structure
+1
See the day's percentage targets from the open, so you know where the session stands at a glance.
Indicator
Forex
BTCUSD
+11
Master trends with Smart ADX: MTF Scanner, precise Buy/Sell signals, Divergence & clear Exit targets 🎯
Indicator
SMC
Forex
+5
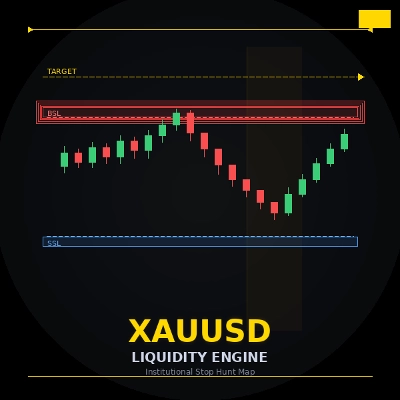
ICT liquidity engine for Gold: maps stop clusters, scores zones & projects the next target. Now with 4 ICT killzones.
Indicator
Risk Dashboard
AI-powered daily range forecasts help traders spot volatility opportunities and plan stops and targets.
Indicator
Signal
Supertrend
Multi-symbol multi-timeframe SuperTrend panel with watchlist, one-click jump, and alerts.
Indicator
Volume
Key Levels
Interactive tick-volume profile with a draggable range box, sculpted histogram, and POC, VAH and VAL levels.
Indicator
MACD
Prop
+14
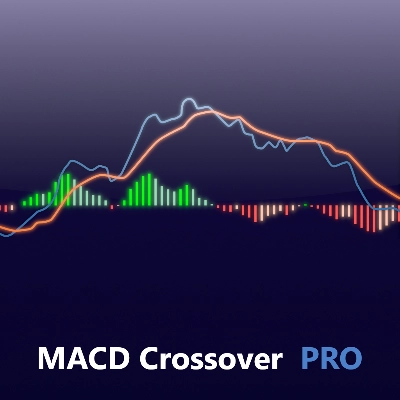
Customize the MACD! Choose colors, get real-time tick updates, and see crossover points for enhanced trading precision.
Indicator
Volume
Key Levels
Draw custom tick-volume profiles with POC, Value Area, fixed/live ranges and optional price alerts.
Indicator
Drawdown Monitor
Protect your funded account. Real-time Daily Equity Drawdown monitor with Green / Orange / Red flashing alerts.
Indicator
Grid
Prop
+14
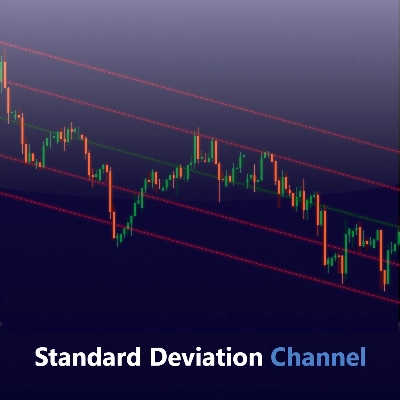
Visualize trends with Standard Deviation Channel! Display median, and add customizable upper/lower deviation channels.
Indicator
RSI
Forex
+6
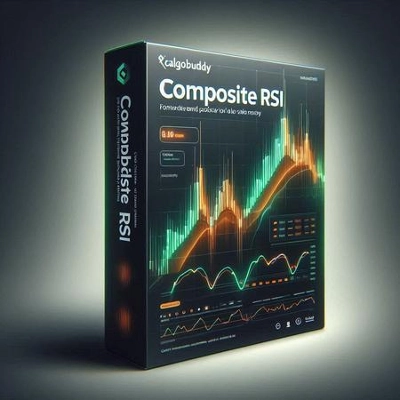
What Constance Brown did with the RSI was to input a momentum calculation within the RSI itself. This the Composite RSI.
Indicator
AI
ATR
+20
Buy and Sell Signals
Indicator
Forex
Crypto
+6
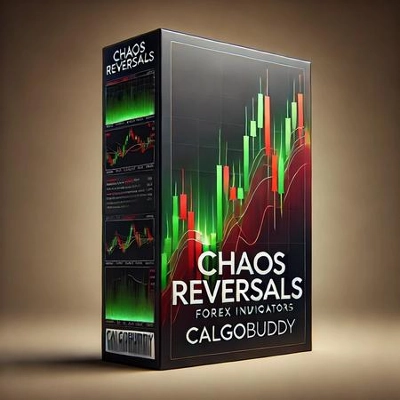
The cTrader Chaos Reversals indicator brings high-quality reversal signals to traders.
Indicator
MultiTF Pivot and SR Indicator
Indicator
Visually master the Inside Bar strategy with clear breakout signals and professional chart highlighting 📈🔔📉

Price

Since 16/09/2026