


Description
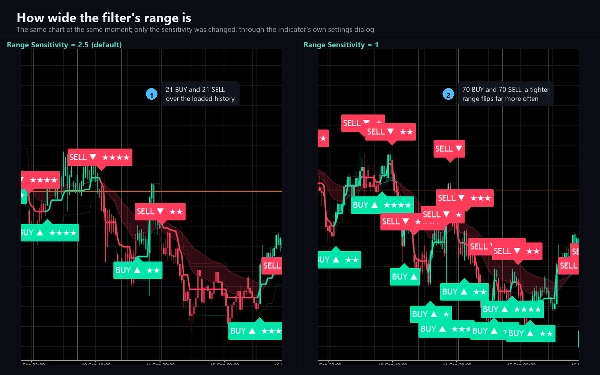
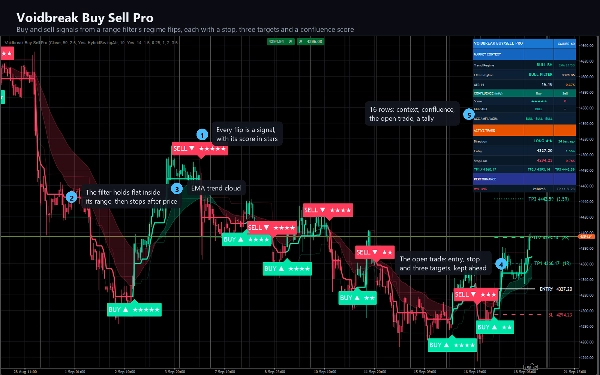
Voidbreak Buy Sell Pro draws a range filter: a line that holds still while price moves inside a
smoothed range of it, and steps after price only when price leaves that range. While the line is flat,
nothing happens - that is the void. When price breaks out and the line starts stepping in the new
direction, the regime flips, and the flip is the signal: BUY when it turns bullish, SELL when it
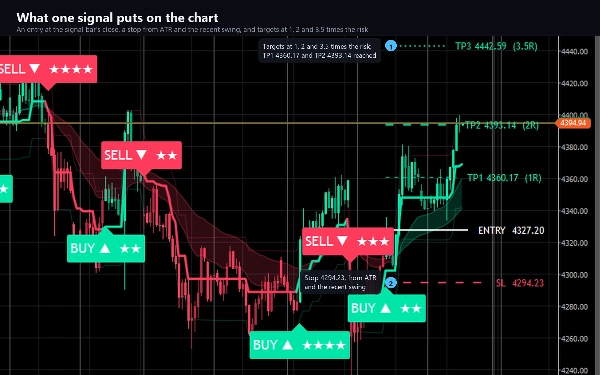
turns bearish. Every signal arrives with a stop, three targets and a score.
WHAT IT DRAWS
- The range filter, three pixels wide, coloured bullish while it steps up and bearish while it steps
down, with a faint band above and below it.
- Candles coloured by the filter's direction - full colour when the candle closes with it, lighter
when it closes against it.
- A trend cloud between a 21 and a 50 EMA, in the colour of whichever is on top. It is display only.
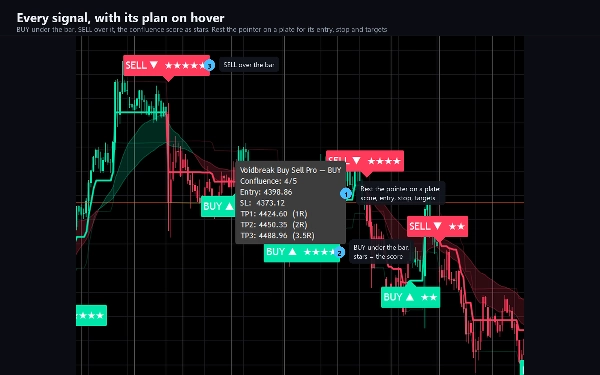
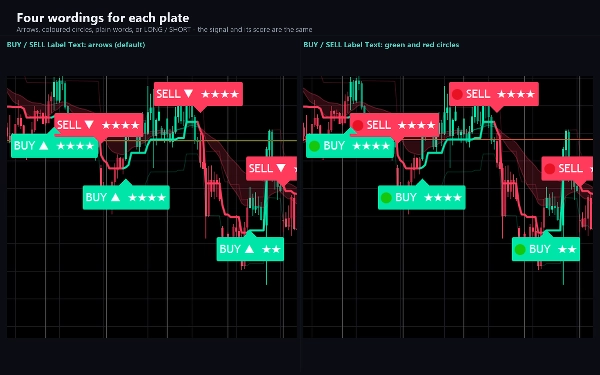
- A plate on every signal bar - BUY below the candle, SELL above it - with the confluence score as stars.
Rest the pointer on a plate to see its score, entry, stop and all three targets.
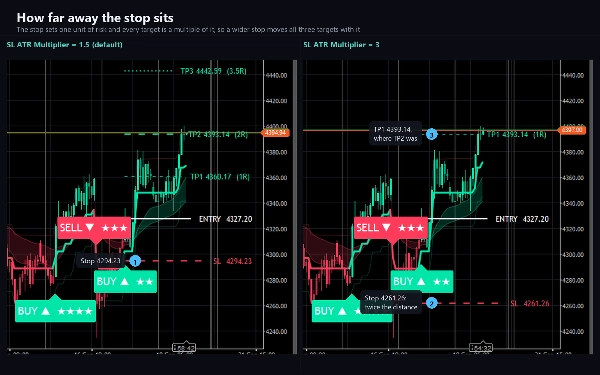
- For the open trade: an entry line, a stop, and three targets at 1, 2 and 3.5 times the risk, each
with a price tag, carried forward bar by bar so they always run ahead of price. When the trade
closes, its lines are removed; the next signal draws a new set.
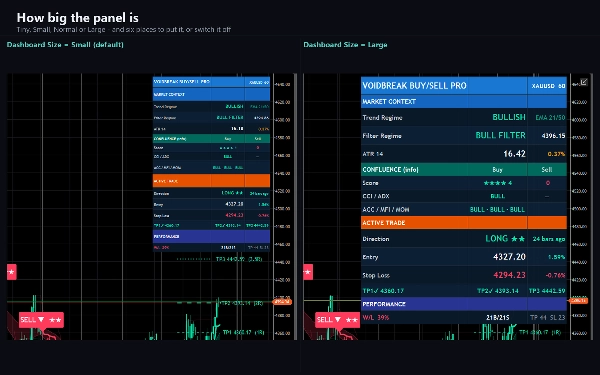
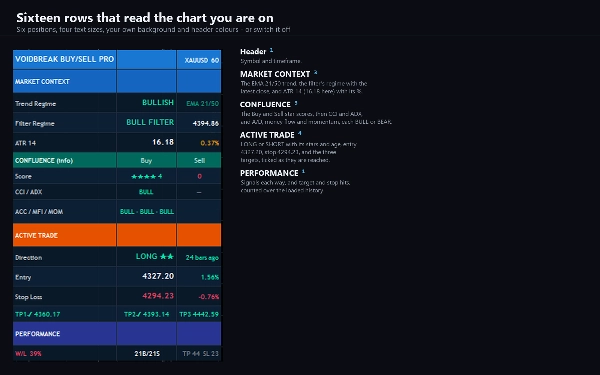
- A sixteen-row panel in four sections: the market context (EMA trend, filter regime, ATR), the
confluence reading for both sides, the active trade with its entry, stop and targets ticked as they
are reached, and a running count of signals, targets reached and stops reached.
HOW IT DECIDES
Only one trade is followed at a time, and it always runs in the direction of the last flip, so every
flip closes the trade before it and opens the other side. A signal is decided when its bar closes and
never moves afterwards. Targets and the stop are checked as the bar forms.
The stop has three modes. Hybrid, the default, uses the tighter of an ATR stop and a stop beyond the
recent swing, whose lookback shrinks on faster charts. Pure ATR uses the ATR stop alone. Recent Swing
uses the swing alone. The risk is never smaller than ten ticks.
The five confluence stars - CCI, ADX with the directional lines, accumulation/distribution, money
flow and a regression of momentum - are information only. They are shown on the plate and in the
panel, and they never hold a signal back. A factor you switch off simply stops scoring.
KEY SETTINGS
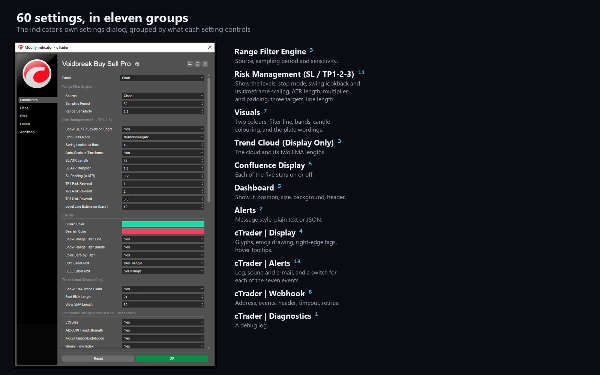
60 in eleven groups. The filter's source, sampling period and sensitivity; the stop mode, swing
lookback and its timeframe scaling, the ATR length, multiplier and padding, three risk-to-reward
targets and how far the level lines run; two colours, the filter line, its bands, candle colouring
and four wordings for each plate; the cloud and its two EMA lengths; each confluence factor on or off;
the panel's position, size, background and header colour; the alert message style; and cTrader groups
for display, alerts, the webhook and diagnostics.
ALERTS AND WEBHOOK
Seven events, each with its own switch: BUY, SELL, either signal, the first, second and third target,
and the stop. Delivered as a cTrader log line, a sound of your choice, and e-mail. A signal alert
carries the entry, the stop, all three targets and the score. Nothing fires while the indicator walks
the chart's history, and nothing fires in a backtest.
A webhook posts signals - and, if you choose, targets and stop events - as JSON to any address you
enter: a trading bot, a journal, a relay, an automation flow. It stays off until you enter one, it is
deduplicated per event per bar, capped at twenty messages a minute, and a failure is logged rather
than thrown. It sends through cTrader's own networking service, which is why the indicator needs no
file or network access rights at all.
TYPE AND WINDOW
An overlay indicator: everything is drawn on the price chart, and it adds no separate pane.
TIMEFRAMES AND INSTRUMENTS
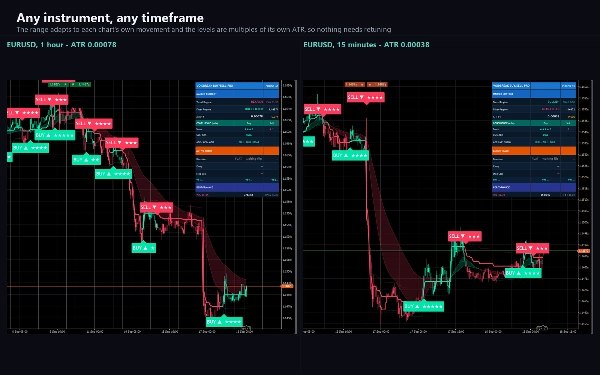
Any. The range adapts to each chart's own movement, the stop and targets are multiples of that
chart's own ATR, and prices are formatted to your broker's own tick, so nothing needs retuning between
a five-minute chart and a daily one, or between a five-decimal pair and gold. The accumulation and
money-flow stars read your broker's tick volume; no signal or level does.
USE CASES
- Following a trend from the moment it breaks out of a quiet range, and standing aside while it is
flat.
- Turning each signal into a plan: one stop and three targets, drawn before you act.
- Reading how much agreement stands behind a signal, from its stars.
- Being told by log line, sound, e-mail or webhook when a signal fires or a target is reached.
WHO IT IS FOR
Traders who want clear buy and sell points that stay quiet in a range, and anyone who wants a signal
to arrive with a stop and a set of targets rather than an arrow.
TRIAL
The free trial is the full indicator on EURUSD only - every broker suffix works. On any other symbol
it shows a notice and draws nothing. No time limit, no reduced history, no missing features. The full
version removes the symbol restriction and changes nothing else.
TECHNICAL NOTES AND LIMITATIONS
Access rights: none. The indicator cannot read files, start processes or open connections of its own.
It is a charting and analysis tool. It does not place orders and it has no access to your account.
The range filter settles over the first few hundred bars of a chart, so load some history before
reading its earliest signals. In Recent Swing mode the swing is read only on signal bars, and on
many buy signals that places the stop very far below the entry. Hybrid, the default, and Pure ATR are
not affected.
The panel's PERFORMANCE row counts what the drawn levels met on the bars your chart has loaded. A stop
reached after the first target counts as a win, and a trade closed by the next flip counts as a win
when it closed at or beyond its entry. It is a description of that history, not a backtest and not a
forecast.
SUPPORT
Questions go through the Discussion tab. Include your broker, symbol, timeframe, cTrader version and
a screenshot of the whole chart, and you will get a useful answer first time.
Trading involves risk. Past performance does not guarantee future results.
Summary
The indicator visually displays the range filter line with colored bands, candles shaded by filter direction, and a trend cloud based on 21 and 50 EMAs. Signal bars are marked with buy/sell plates showing a confluence score derived from five technical factors (CCI, ADX, accumulation/distribution, money flow, and momentum regression), which provide informational context but do not affect signal generation.
A live panel summarizes market context, confluence readings, active trade status, and performance metrics including counts of signals, targets, and stops reached. Alerts for signals, targets, and stops can be delivered via cTrader log, sound, email, or webhook in JSON format for integration with external systems.
Voidbreak Buy Sell Pro supports extensive customization with 60 settings covering filter parameters, stops, targets, colors, alerts, and display options. It requires no special access rights and does not place orders. The indicator is intended for traders seeking clear, actionable buy and sell signals with integrated trade management tools.




























