Keltner Channels advanced
อินดิเคเตอร์
เวอร์ชัน 1.0, Apr 2026
Windows, Mac
5.0
รีวิว: 1
คำอธิบาย
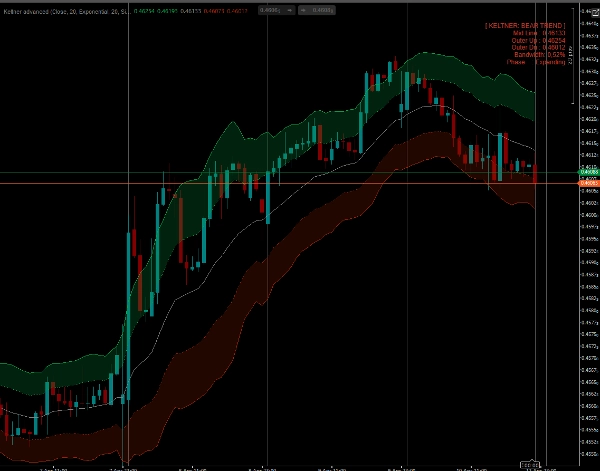
ระบบคลาวด์ขั้นสูงและระบบเบรกเอาต์ Keltner Channels
Keltner Channels มาตรฐานเป็นเครื่องมือที่ยอดเยี่ยมสำหรับการอ่านความผันผวนและทิศทางแนวโน้ม แต่การวาดเส้นง่ายๆ บนชาร์ตก็เป็นเพียงจุดเริ่มต้นเท่านั้น
Keltner Advanced นำตัวชี้วัดคลาสสิกนี้ไปสู่ระดับใหม่ทั้งหมด โดยการแนะนำระบบคลาวด์แบบแบนด์คู่ การตรวจจับการบีบแคบของแบนด์วิดท์ และ Smart Paintbars มันเปลี่ยนช่องทางง่ายๆ ให้กลายเป็นระบบการซื้อขายที่สมบูรณ์และมองเห็นได้สำหรับผู้ซื้อขายเบรกเอาต์และผู้ติดตามแนวโน้ม
คุณสมบัติหลัก
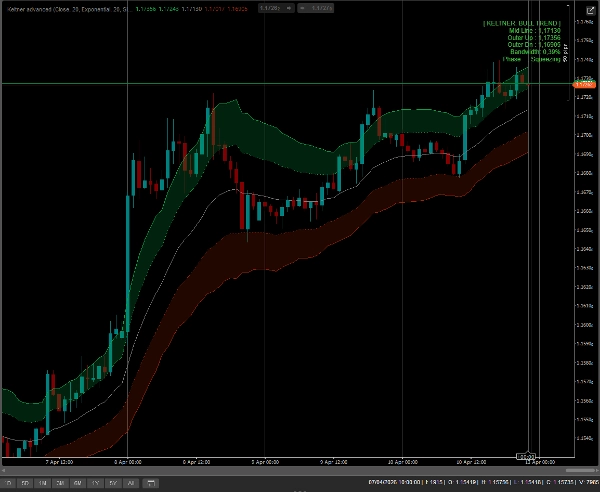
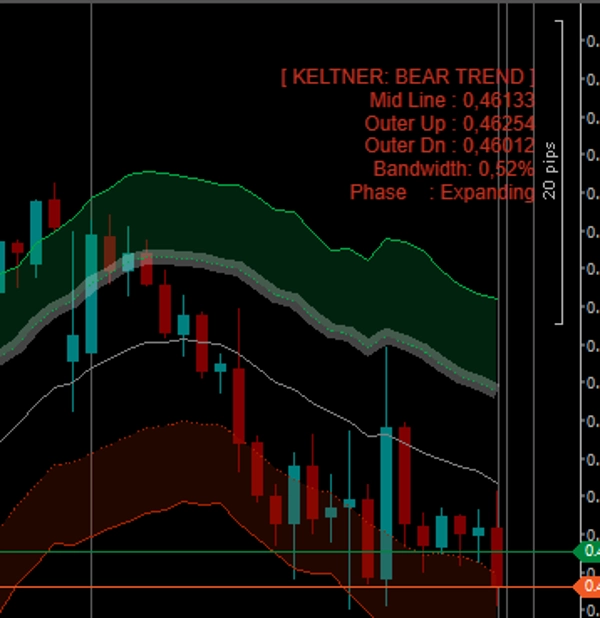
- ระบบคลาวด์แบบแบนด์คู่ (โซนปฏิบัติการ): แทนที่จะเป็นช่องทางเดียว ตัวชี้วัดนี้จะวาดแบนด์ภายในและแบนด์ภายนอก พื้นที่ระหว่างพวกมันถูกเติมด้วยคลาวด์ที่เคลื่อนไหวได้
-
- ราคาภายในคลาวด์? คุณอยู่ใน "การขี่แนวโน้ม" ที่แข็งแกร่งและมีสุขภาพดี
- ราคาระหว่างเส้นกลางและแบนด์ภายใน? คุณอยู่ในช่วงดึงกลับ / การกลับสู่ค่าเฉลี่ย
- การระบายสีแท่งเทียนอัจฉริยะ (Paintbars): แท่งเทียนของคุณจะเปลี่ยนสีตามตำแหน่งที่แน่นอนภายในโครงสร้างช่องทาง:
-
- สีเขียว/แดงนีออน (ขั้นสุด): ราคาทะลุออกนอกแบนด์ภายนอก โมเมนตัมมหาศาลหรือจุดสุดยอด!
- สีเขียว/แดงสดใส (แนวโน้ม): ราคากำลังเคลื่อนที่ภายในคลาวด์ Keltner
- สีเขียว/แดงเข้ม (ดึงกลับ): ราคากำลังดึงกลับไปยังเส้นกลาง
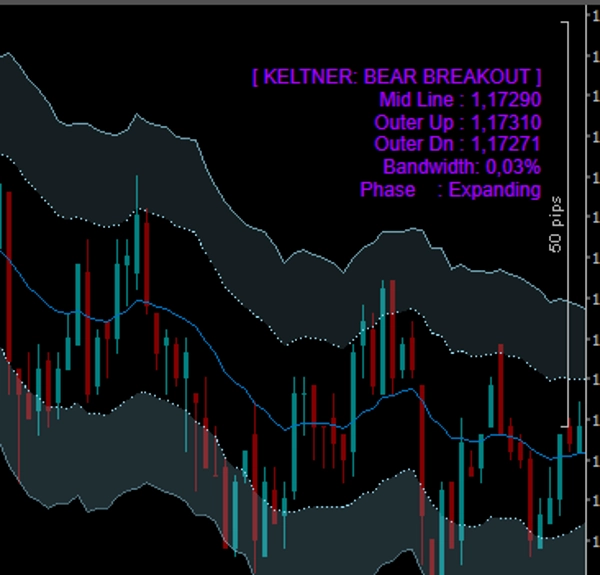
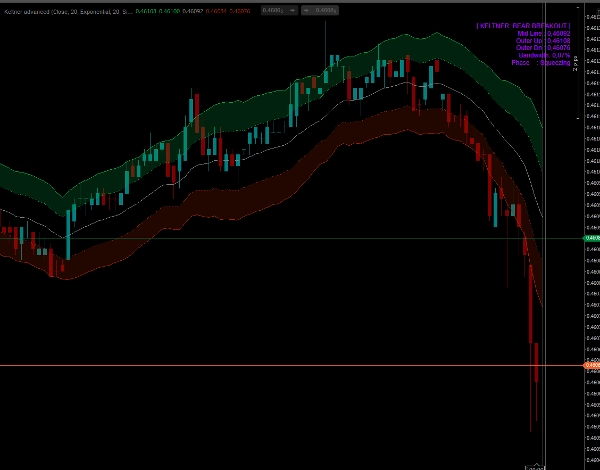
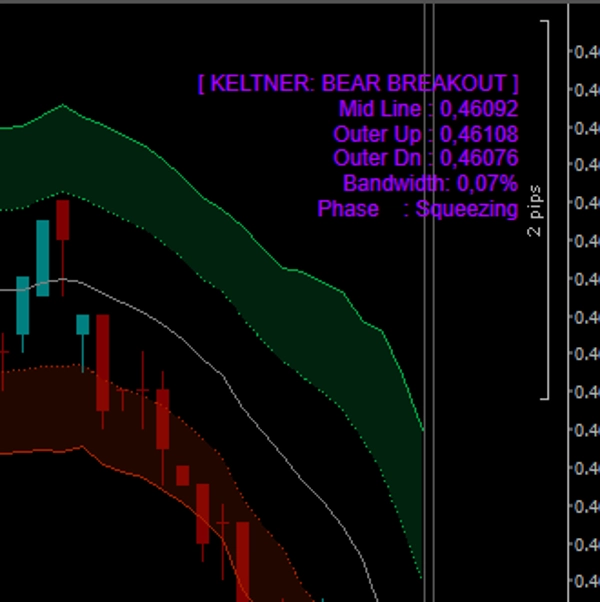
- การตรวจจับการบีบแคบของแบนด์วิดท์: ตัวชี้วัดจะคำนวณความกว้างของช่องทางอย่างต่อเนื่องและเปรียบเทียบกับแท่งก่อนหน้า แดชบอร์ดจะแจ้งให้คุณทราบอย่างชัดเจนว่าตลาดกำลังบีบแคบ (บีบอัดเพื่อเบรกเอาต์) หรือขยายตัว
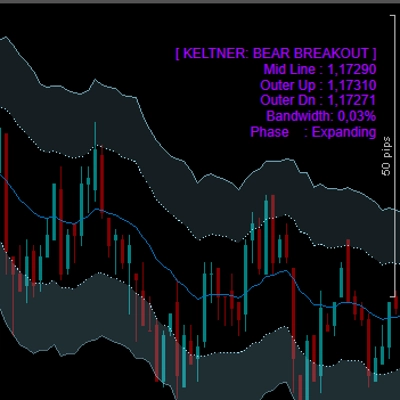
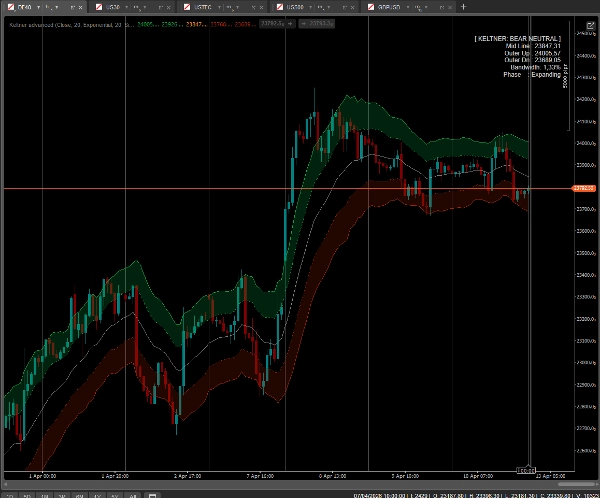
- แดชบอร์ดบนชาร์ตแบบเรียลไทม์: แผงควบคุมที่เรียบง่ายและไม่รบกวนจะแสดงสถานะตลาดปัจจุบัน (แนวโน้มกระทิง, เบรกเอาต์หมี, เป็นกลาง ฯลฯ) ระดับแบนด์ที่แน่นอน เปอร์เซ็นต์แบนด์วิดท์ และเฟสความผันผวน
- ปลดล็อกอย่างสมบูรณ์: ซื้อขายได้กับสัญลักษณ์ใดก็ได้ (Forex, Crypto, ดัชนี, หุ้น) และกรอบเวลาที่ใดก็ได้โดยไม่มีข้อจำกัด เข้าถึงได้ตลอดชีพ
วิธีการเทรดกับมัน?
- เบรกเอาต์: ดูที่แดชบอร์ดสำหรับช่วง "บีบแคบ" เมื่อราคาระเบิดออกนอกแบนด์ภายนอกและแท่งเทียนระบายสีเป็นสีเขียวหรือแดงนีออน ให้เทรดเบรกเอาต์ด้วยโมเมนตัมที่แข็งแกร่ง
- การขี่แนวโน้ม: เมื่อแนวโน้มถูกสร้างขึ้นแล้ว ให้คงอยู่ในเทรดของคุณตราบใดที่แท่งเทียนระบายสีเป็นสีเขียวหรือแดงสดใสและ "เลื่อน" อยู่ภายในคลาวด์
- การซื้อเมื่อราคาดิ่งลง: เมื่อราคาดึงกลับไปยังเส้นกลางสีส้ม (แท่งเทียนเปลี่ยนเป็นสีเขียวเข้ม) มักจะเป็นจุดเข้าที่มีความเสี่ยงต่ำเพื่อเข้าร่วมแนวโน้มหลัก
สรุป
โปรไฟล์อินดิเคเตอร์
หมวดหมู่อินดิเคเตอร์
ความผันผวน
ประเภทเอาต์พุต
การแสดงเป็นภาพ
สัญญาณ
ตัวกรอง
ข้อกำหนดด้านข้อมูล
แท่งเท่านั้น
สัญญาณที่รองรับ
ความแข็งแกร่งของแนวโน้ม
ความผันผวน
Breakout
รีวิวจากลูกค้า
5.0
รีวิว: 1
5 | 100 % | |
4 | 0 % | |
3 | 0 % | |
2 | 0 % | |
1 | 0 % |
การสนทนา
คำถามที่พบบ่อย
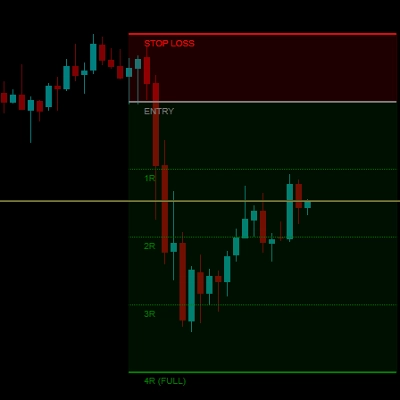
Key Levels
Channel
ผลิตภัณฑ์ที่มีให้บริการผ่าน cTrader Store รวมถึงบอทการเทรด อินดิเคเตอร์ และปลั๊กอิน มีให้บริการโดยนักพัฒนาบุคคลที่สามและมีไว้เพื่อวัตถุประสงค์ในการเข้าถึงข้อมูลและทางเทคนิคเท่านั้น cTrader Store ไม่ใช่โบรกเกอร์และไม่ได้ให้คำแนะนำการลงทุน คำแนะนำส่วนบุคคล หรือการรับประกันผลการดำเนินงานในอนาคต


ราคา
24
การขาย
710
ติดตั้งฟรี