شعار "All PivotPoint Pro"
All PivotPoint Pro
صورة "All PivotPoint Pro" المحملة
منذ 30/01/2025

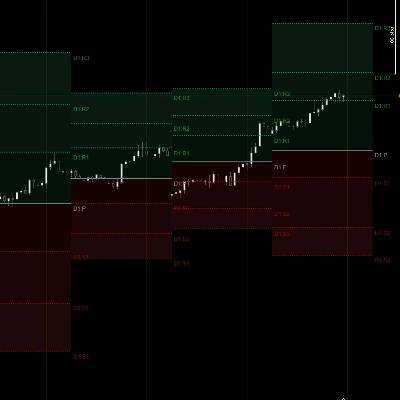
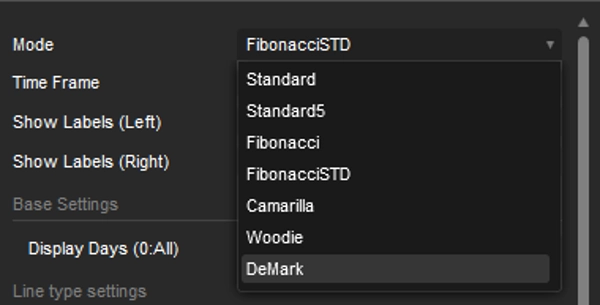
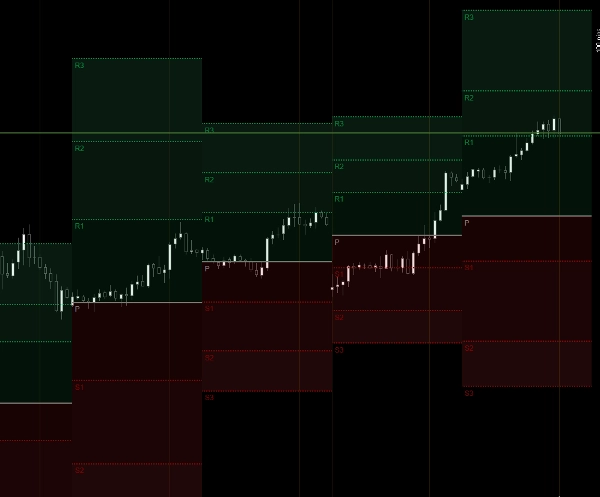
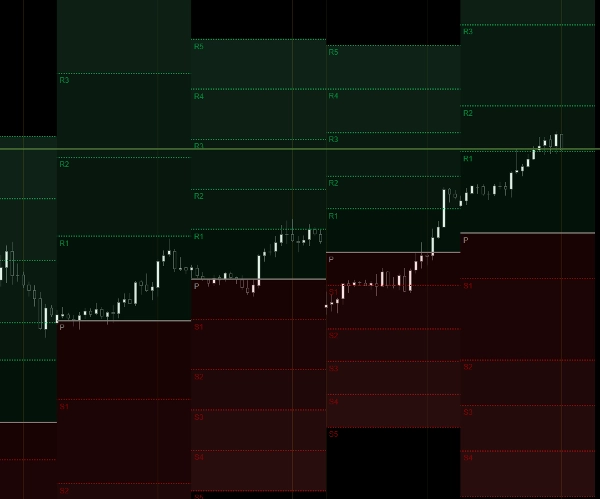
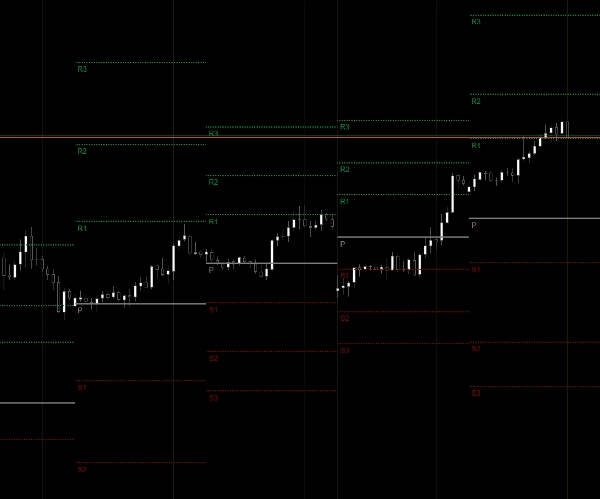
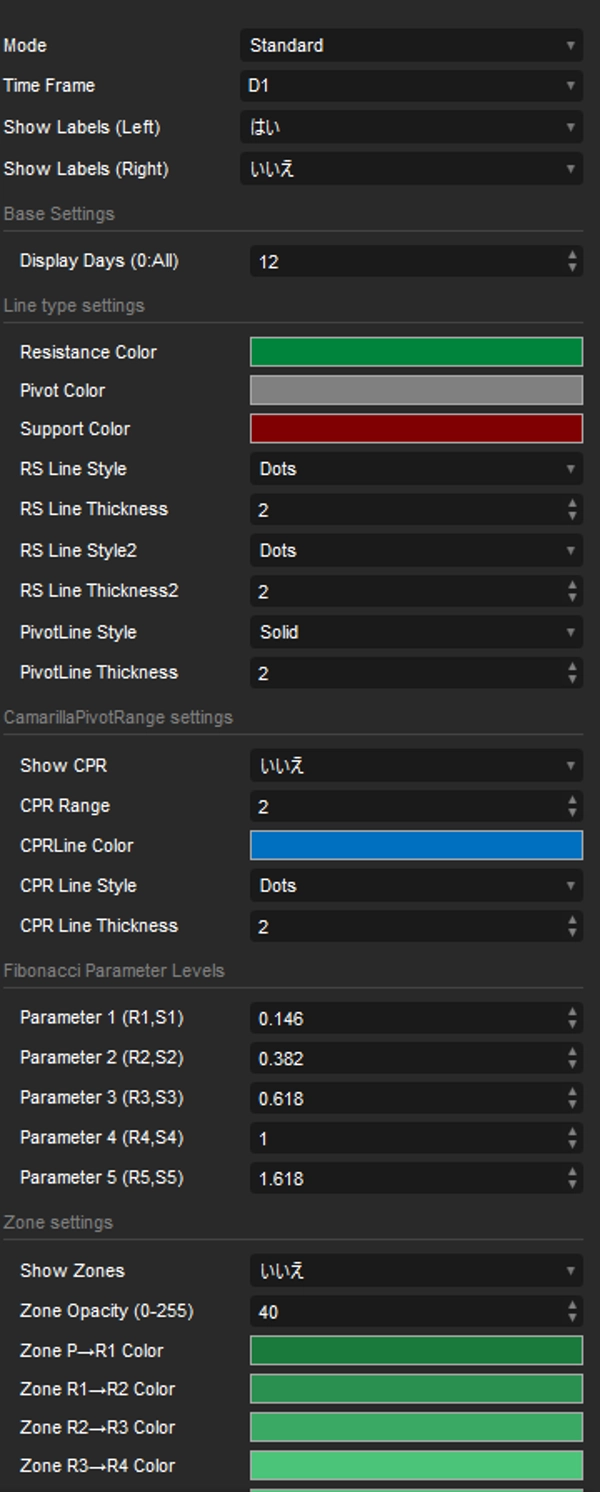
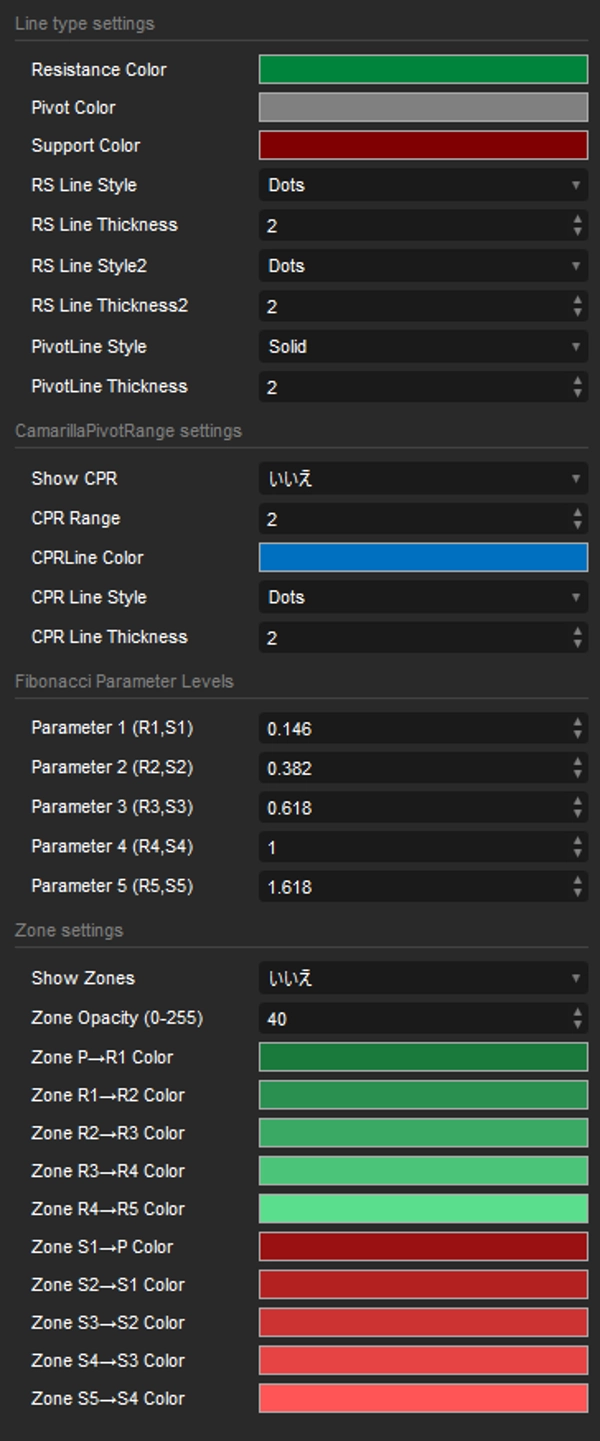
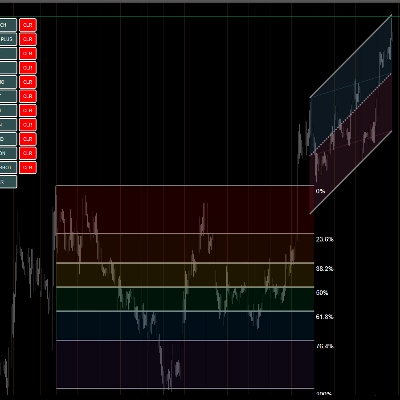
AllPivotPointPro is a complete pivot‑point analysis tool supporting Standard, Fibonacci, Camarilla, Woodie, and DeMark modes. It automatically draws pivot, support, and resistance levels, CPR ranges, and multi‑level zones with customizable colors and opacity. The indicator displays both left‑side labels and right‑side TF‑based price labels (e.g., D1:R1), making intraday structure easy to read. Zone shading between each level provides clear visual context, while DisplayDays allows selective historical visibility. Designed for traders who rely on precise, clean, and multi‑mode pivot mapping for daily and intraday decision‑making.

ملف تعريف المؤشر
0.0
التقييمات: 0
تقييمات العملاء
لا توجد تقييمات لهذا المنتج حتى الآن. هل جرَّبته بالفعل؟ كن أول من يخبر الآخرين!
Support & Resistance
يتم توفير المنتجات المتاحة من خلال cTrader Store، بما في ذلك روبوتات التداول والمؤشرات والإضافات، من قبل مطوري الطرف الثالث وإتاحتها لأغراض الوصول المعلوماتي والفني فقط. cTrader Store ليس وسيطًا ولا يقدم نصائح استثمارية أو توصيات شخصية أو أي ضمان للأداء المستقبلي.

المزيد من هذا المؤلف

Detects and draws FVG, OB, NWOG, NDOG, and Equilibrium zones with auto mitigation and visual labeling.
A multifunctional drawing suite offering channels, Fibo tools, Gann tools, regression, and one‑shot ZigZag with a fully

قد يعجبك أيضًا

شعار "Period Separator"
5.0
(2)
مجاني
Period Separator that shows on all timeframes including renko and range bars.
Label each candle sequentially with flexible session resets.
Professional ZigZag Fibonacci tracer. Automated institutional level detection with dynamic market structure mapping.
TwoSMA indicator detects trend via SMA crossover, filters flat markets with ATR, and provides clear BUY and SELL signals
It shows where the most trading activity occurred, highlighting key support/resistance zones
Price Projection Swing Volume maps future paths using swing pivots and Fibonacci ratios. Visual, geometric and precise.!
Bring the RMA to cTrader! This is the Relative Moving Average from TradingView.
شعار "Bollinger Bands Advanced"
$ 20
/
$30
Bollinger Bands Advanced Squeeze & Breakout System, Real-Time On-Chart Dashboard, Auto-Squeeze Detector, Dual-Band Cloud
A function demo version of VWAP indicator with std. dev. bands. Expired on 1st Aug, 2025.
The RSI NextGen is an advanced and modernized version of the classic Relative Strength Index (RSI)
FBX VWAP Anchored — Professional VWAP
شعار "HA"
$ 19
Pro Heikin Ashi Visual Overlay – Clean Trend Visualization
شعار "E7 Indicators Free Overlays"
5.0
(2)
مجاني
Bollinger Band Cloud, Heiken Ashi, Trend Follower and Parabolic SAR.
Revolutionize Your Chart Analysis with Hybrid Candles & Precision Timing
شعار "Stochastic RSI PRO"
5.0
(1)
$ 28
/
$40
Unlock Stochastic RSI PRO in cTrader! Overlay RSI, highlight zones, and identify divergences with customizable settings.
🚀 Auto-detects support/resistance & trend channels! Saves time ⏳, spots key levels 🔍
DXY HMA Indicator
Enhance your trading strategy with automated detection and alerts for key chart patterns.
منذ 30/01/2025