Description
Royal Trend Commander X
The Ultimate Multi-Timeframe Trend Intelligence System
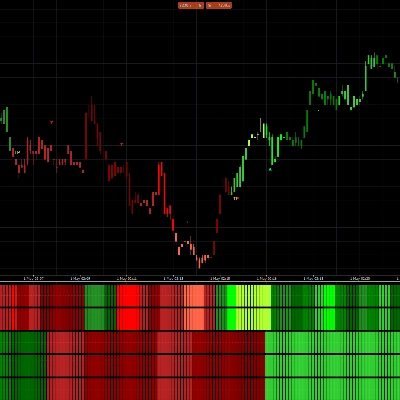
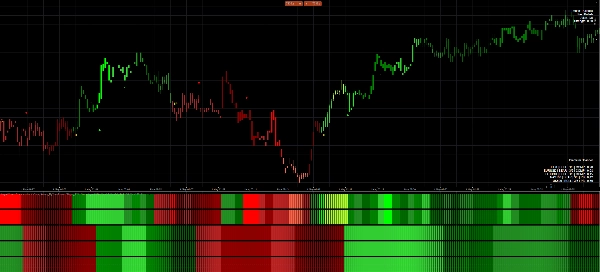
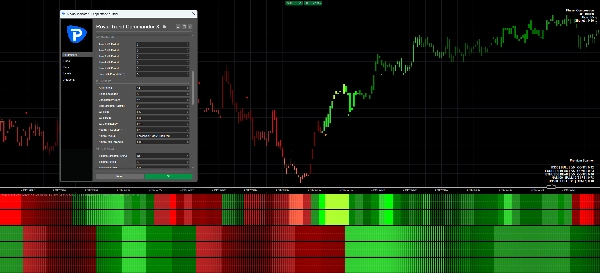
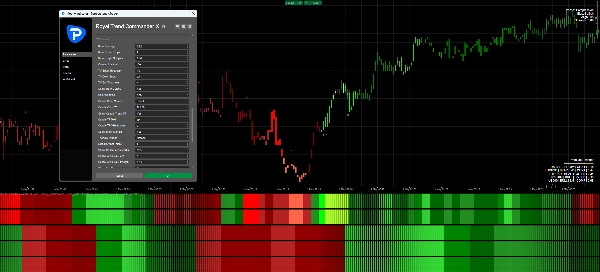
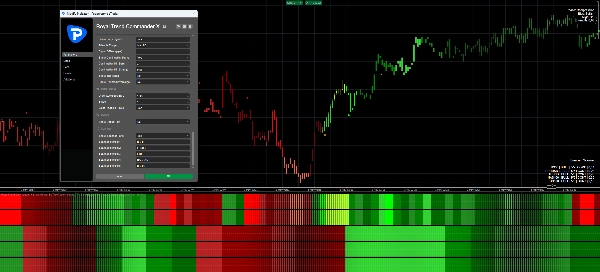
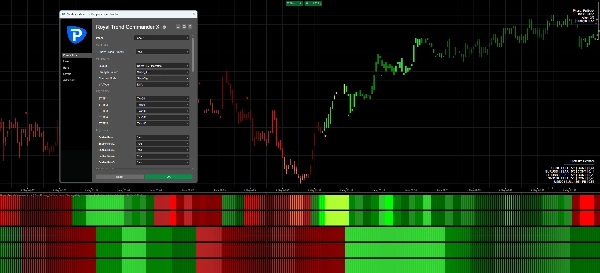
Royal Trend Commander X is built to command the market with clarity, speed, and precision. It combines a powerful multi-timeframe heatmap, dynamic candle coloring, trend alignment logic, entry signals, continuation marks, reversal awareness, and intelligent TP alerts into one premium trading dashboard.
At its core, Royal Trend Commander X analyzes multiple short-term and tick-based timeframes simultaneously. Instead of forcing traders to guess where momentum is building, it displays the dominant trend structure directly through a clean, visual heatmap. When the rows align, the system reveals where market pressure is strongest and where the next high-probability move may be forming.
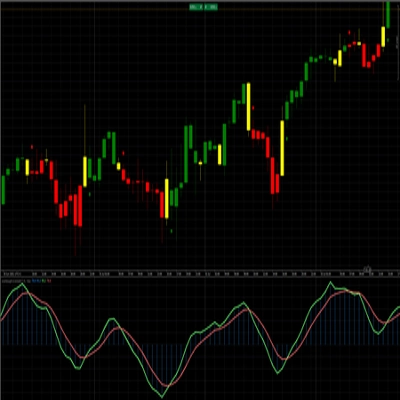
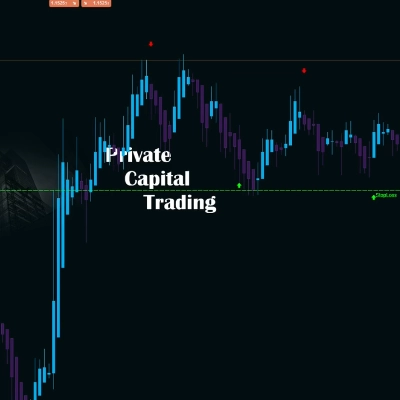
The candle coloring engine acts as the leading trend compass. It helps traders instantly see when the active market bias is bullish or bearish, while the signal engine waits for stronger confirmation across the selected rows. This creates a powerful balance between early trend awareness and disciplined entry confirmation.
One of the standout features is the intelligent golden TP logic. Royal Trend Commander X does not throw random take-profit marks on every color change. A TP alert only appears after a valid trend signal has been established and the confirmed candle-color trend breaks. This keeps the chart clean, focused, and meaningful.
Why it feels royal:
It filters market noise.
It aligns multiple timeframes.
It highlights trend strength visually.
It confirms entries with structure.
It marks potential trend exits intelligently.
It keeps the trader focused on momentum, direction, and timing.
Royal Trend Commander X is designed for traders who want more than a basic indicator. It is a complete visual trend-command system created to bring confidence, discipline, and premium market clarity to every chart.
How It Works
Royal Trend Commander X reads the market like a command center.
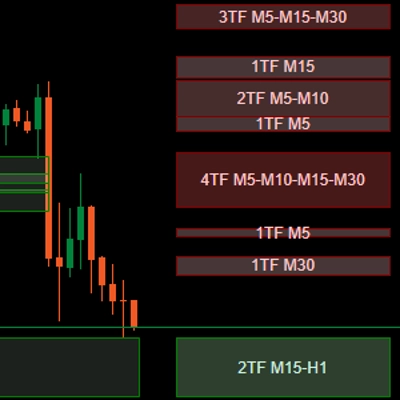
Instead of looking at only one timeframe, it scans multiple short-term and tick-based timeframes at the same time. Each row in the heatmap represents a selected timeframe or moving-average layer. When a row turns green, bullish pressure is active. When a row turns red, bearish pressure is active. The stronger the color, the stronger the trend force.
The system measures trend direction and strength using moving-average behavior, ATR-based momentum, slope, spread, and consistency. This helps filter out weak moves and highlights the moments when the market is building real pressure.
The heatmap is the core of the system. It shows whether the market is mixed, compressing, pulling back, continuing, expanding, or showing reversal risk. When more rows align in the same direction, the system sees stronger trend agreement.
The candle coloring engine works as the leading visual guide. It shows the active short-term bias directly on the candles, so traders can quickly see whether price action is currently controlled by buyers or sellers.
The signal engine waits for confirmation. A buy or sell signal appears only when enough rows align according to the selected trigger setting, such as Match 3, Match 4, or Match 5. This makes the signal more disciplined because it is not based on one single condition.
Continuation marks help identify when an existing move still has strength. They appear when the trend remains aligned for enough bars and the average strength stays strong.
Reversal warnings and exit marks help traders stay aware when the structure starts to weaken or when the previous trend alignment breaks.
The golden TP logic is designed to be smart and selective. It does not mark every candle color change. First, a valid trend signal must appear. Then the system watches the candle-color trend. Only when that confirmed trend breaks does the golden TP appear. This gives traders a clean, logical take-profit alert based on trend failure after a valid move.
In simple terms:
Royal Trend Commander X first reads the market pressure, then confirms the trend, then tracks the move, and finally warns when the move may be losing control.
It is built to help traders see direction, strength, timing, continuation, and potential exit points in one clean visual system.