"Bias_Ctrader" logo
Indicator
Version 1.0, Jun 2026
Windows, Mac
"Bias_Ctrader" uploaded image
Since 10/03/2026

¿Te cuesta determinar la dirección correcta del mercado al inicio de tu sesión? El Daily Bias Candles & Levels Indicator automatiza por completo tu análisis diario.

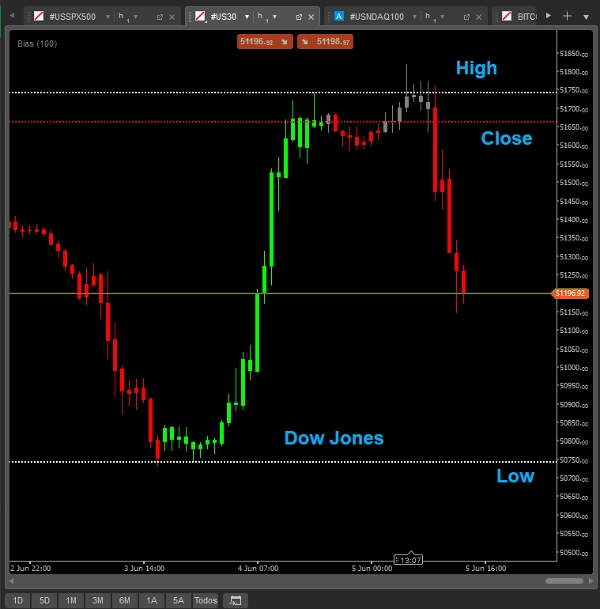
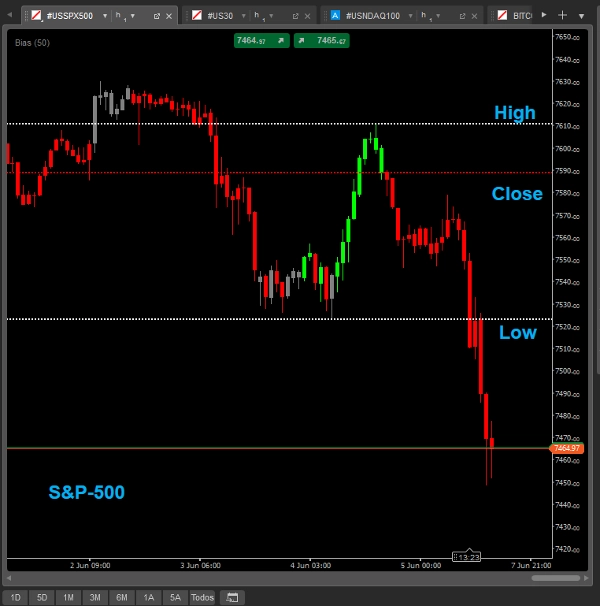
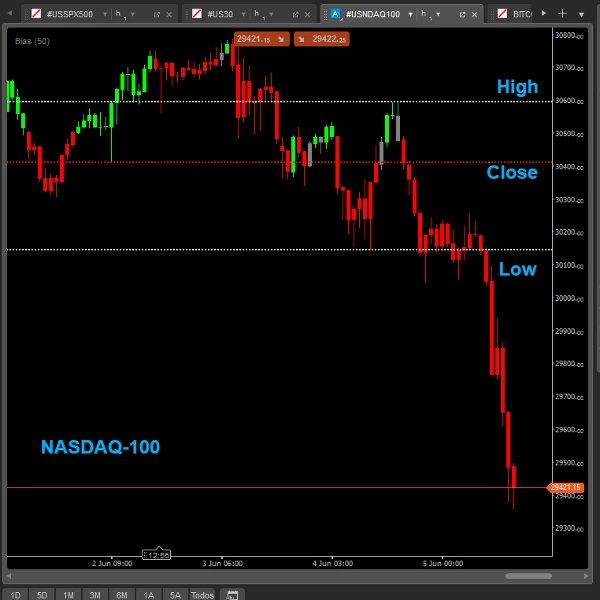
El algoritmo calcula matemáticamente el Máximo (High), el Mínimo (Low) y el Precio de Cierre (Close) de la sesión anterior en cualquier activo. A partir de estos niveles clave, el indicador define con precisión si el mercado se encuentra en una zona de continuidad alcista, continuidad bajista, fase de retroceso o fase lateral.

Para que no pierdas el enfoque mientras operas, el indicador colorea las velas en tiempo real. Esto te recuerda instantáneamente si estás por encima o por debajo de los niveles clave, permitiéndote ejecutar estrategias alineadas con el verdadero sesgo institucional del día.


¿Cómo funciona el mapeo de zonas y velas?

  • Zonas de Continuidad Alcista (Bullish Extension): Velas de color personalizado cuando el precio rompe y se mantiene con fuerza por encima del Máximo previo. ¡Hora de buscar expansiones hacia arriba!
  • Zonas de Continuidad Bajista (Bearish Extension): Velas de color personalizado cuando el precio cotiza por debajo del Mínimo previo. Ideal para acompañar los impulsos de venta masivos.
  • Fases de Retroceso / Rango Lateral: Colores neutros o de advertencia cuando el precio cotiza atrapado entre el Máximo/Mínimo y el Cierre anterior. Te protege de operar en zonas de acumulación sucias o trampas de mercado.


Optimiza tu plan de trading, evita operar en el lado incorrecto del mercado y sigue la liquidez del dinero inteligente. ¡Descarga tu versión hoy mismo!

Indicator profile
Indicator category
Trend
Output type
Visualisation
Filter
Data requirements
Bars only
Supported signals
Trend strength
Reversal
Level touch
0.0
Reviews: 0
Customer reviews
No reviews for this product yet. Already tried it? Be the first to tell others!
Supertrend
Imbalance
Order Block
Market Structure
Supply & Demand
Liquidity Grab
Support & Resistance
Products available through cTrader Store, including trading bots, indicators and plugins, are provided by third-party developers and made available for informational and technical access purposes only. cTrader Store is not a broker and does not provide investment advice, personal recommendations or any guarantee of future performance.

More from this author

Indicator
EMA
Supertrend
+4
Dynamic dual MA cloud indicator. Identifies trends, crossovers, and pullback entries in real time for any asset.
Indicator
Imbalance
AI-assisted
+4
Predict continuity or rejection on range bars. Plots a precise visual box to anticipate candle close price levels.

You may also like

Indicator
BOS
Fibonacci
+4
Automatically draws major trading sessions, killzones, and SMC daily liquidity targets directly on your cTrader charts.
Indicator
ATR
Forex
+5
Most used candle patterns. (1 candle, 2 candles and 3 candles patterns) and Marubozu. Bonus Fibo Risk control.
Indicator
Prop
Forex
+13
VIX Pro: Volatility Index Tool with ATR-Based Breakout Alerts
Indicator
AI
SMC
+17
Smart Support/Resistance lines auto calculated from D1/H4/H1/M15. Highly customizable visuals + built in Backtest Mode.
Indicator
MCDX is a powerful and innovative indicator.
Indicator
Prop
Forex
+4
Automatic Support/Resistance zones from swing points.
Indicator
AI
ATR
+19
QX SessionBox ORB: Session boxes + ORB levels + clean dashboard with optional closed-candle breakout signals.
Indicator
USDJPY
MarketStructurePro – Smart BOS/CHoCH
Indicator
[Hamster-Coder] Pivot Points (Multi Time Frame)
Indicator
ATR
Channel
+1
Bollinger Bands Advanced Squeeze & Breakout System, Real-Time On-Chart Dashboard, Auto-Squeeze Detector, Dual-Band Cloud
Indicator
ATR
Breaker Block
+5
Display your symbol, timeframe or custom text as a watermark on any chart position with full color and size control.
Indicator
ATR
RSI
+24
Daily moving averages, simplified. Displays 3 daily moving averages on lower timeframes with selectable MA types.
Indicator
Inside Bar
Save time by lighting a candle to look within yourself in another temporality
Indicator
The Advanced Volume Profile Indicator calculates POC, Median, and Mode, revealing key price levels for smarter trading.
Indicator
SMC
Forex
+7
Simple Smart Money Concepts (SMC)
Indicator
ATR
Market Structure
+3
Support Resistance Toolkit
Indicator
ATR
MACD
+15
BrickAlgo TrendPulse is an advanced technical analysis tool that combines multiple indicators with filterin mechanisms.
Indicator
Imbalance
AI-assisted
+4
Predict continuity or rejection on range bars. Plots a precise visual box to anticipate candle close price levels.
Since 10/03/2026