

Description
The problem with regime indicators: they change their minds.
Most regime indicators "learn" from the data while they run. You know the result: the history looks beautiful, because the labels of past bars were silently rewritten after the future arrived. This has a name — repainting — and it is the cardinal sin of any analysis tool: it looks reliable precisely because it erases its own mistakes.
Regime Visualizer makes a single promise: it never repaints.
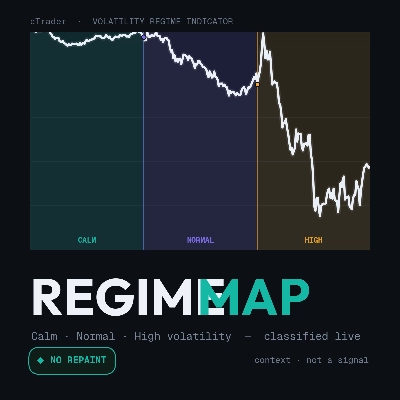
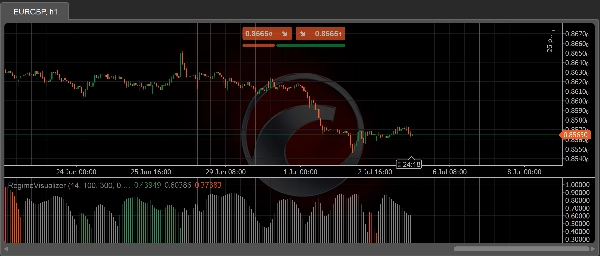
Every bar is classified into one of three volatility regimes — Calm, Normal or High — at the moment it closes. That label is final. It is never recalculated, smoothed or retroactively corrected. The screenshot you take today shows the same thing that was on the screen live, bar by bar. Deterministic: same data, same picture, on every run.
What you see on the chart:
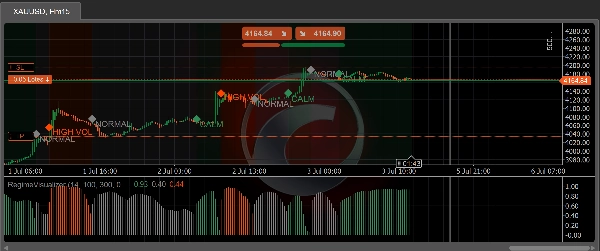
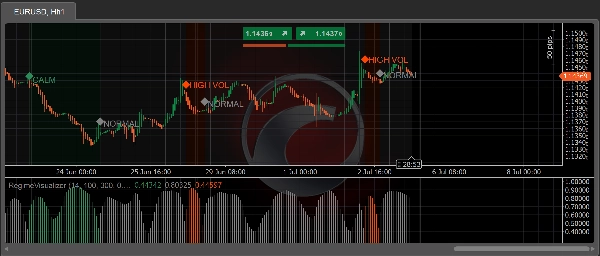
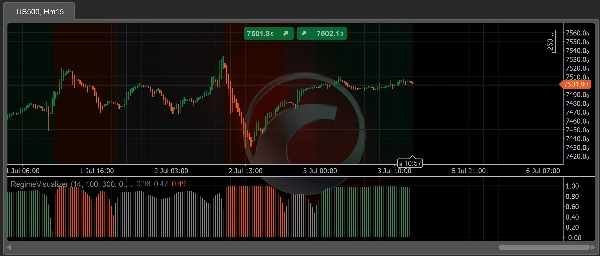
- 🎨 Colored background per regime segment, right on the price chart
- 📊 Confidence histogram (0–1) in a separate panel — the filtered probability of the active regime, in the regime's color
- 🔷 Transition marker — icon + label on the bar where the regime changes
- Each layer toggles on/off independently, with configurable colors
What it is NOT (read before installing):
- ❌ Not a trading signal. It never tells you to buy or sell.
- ❌ No performance promise. Volatility regime does not predict profit — this indicator makes context readable, nothing more. What you do with it is your responsibility.
- ❌ Not adaptive. There is no online learning — on purpose: "learning while running" is exactly what makes regime indicators repaint.
How it works (for those who want to know):
A 3-state hidden Markov model (HMM) with fixed parameters runs on normalized ATR (ATR(14) / 100-bar ATR average — dimensionless, so it works on any instrument and timeframe). Inference is forward filtering only — it uses nothing but data up to the close of the current bar, with no Viterbi and no backward smoothing (the classic sources of repainting). A hysteresis layer with thresholds and a minimum dwell time turns the flickering argmax into a stable read.
Honest about its limits:
- The first 300 bars (warmup) stay unlabeled — the indicator does not pretend to know what it does not know yet.
- The forming bar gets no label — it is classified when it closes. That is the price of never repainting, and we pay it in front of you.
For cBot developers:
The indicator exposes the public RegimeCode series (0 = Calm, 1 = Normal, 2 = High, −1 = warmup) for consumption via Indicators.GetIndicator<RegimeVisualizer>(). Non-repainting volatility context, ready to plug into your logic.
Validation (tested, not claimed):
The non-repaint property was verified by a harness that reprocessed 100,000 real bars across 201 incremental windows — 10.1 million label comparisons, zero divergence — plus bit-identical determinism across runs.
Free. Context — not a signal.
Summary
Discussion
Customer reviews
FAQ







Price