Description
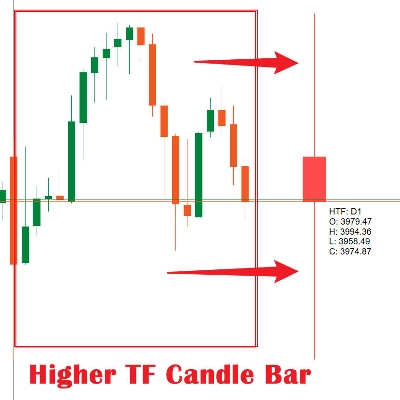
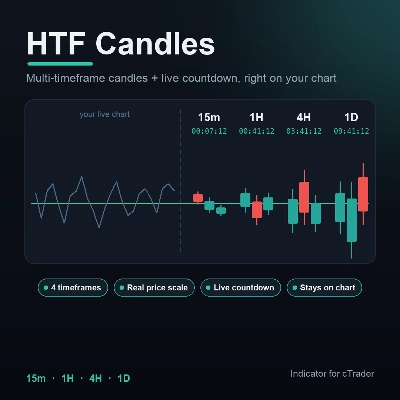
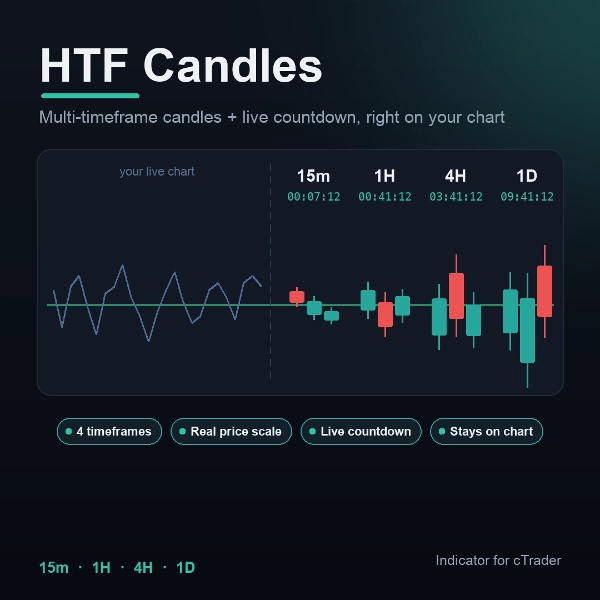
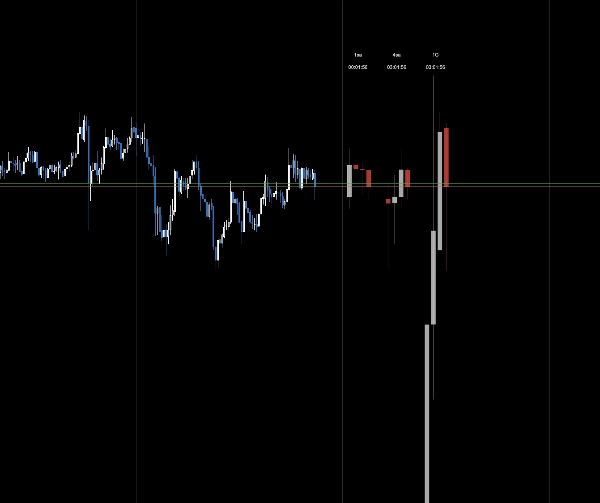
HTF Candles projects the most recent candles of several timeframes directly onto your current chart — all drawn to the same real price scale — so you can read multi-timeframe structure without ever switching charts.
What it shows To the right of live price, HTF Candles plots the last few real candles of each selected timeframe (default 15m, 1H, 4H, 1D). Every candle sits on the chart's actual price axis, so sizes are true to life — a daily candle towers over a 15-minute one, exactly as the market sees it. The right-most candle in each group is the live, still-forming candle and updates tick by tick.
How to read it
- Each column is one timeframe, labeled at the top (15m · 1H · 4H · 1D).
- Directly under each label is a live countdown to that timeframe's next candle close.
- Green/red bodies show bullish/bearish at a glance, so you can confirm higher-timeframe momentum while trading a lower one.
Key settings
- Up to 5 timeframe slots — enable/disable each and choose any timeframe.
- Number of candles per timeframe (default 4).
- Body up/down colors, candle width, spacing, and padding from price.
- Independent toggles for the timeframe label and the countdown, plus font size and color.
Typical use
- Confirm trend alignment across timeframes before entering a trade.
- Time entries and exits around higher-timeframe closes using the countdowns.
- Keep full multi-timeframe context on a single screen — ideal for scalpers and day traders who don't want to flip charts.
Best suited for Intraday and swing traders in any market (forex, indices, crypto, metals) who rely on multi-timeframe analysis and want higher-timeframe context and candle-close timing without leaving their working chart.