
Description
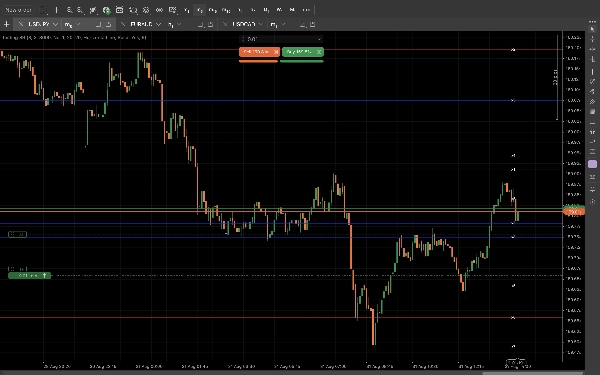
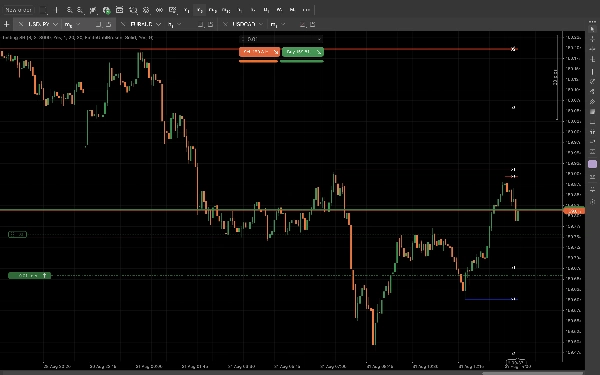
Simple Support and Resistance automatically calculates key turning points across any chart timeframe and draws clean, ultra-thin levels without cluttering your workspace.
Key Features
- Clean & Unobtrusive: Plots minimal, thin price levels that highlight key market structure without overpowering your candles.
- Smart Clutter Filtering: Built-in pip de-stacking prevents overlapping lines while preserving fine-grained, high-precision swing points.
- Master multiple timeframes: seamlessly analyzing everything from 1-minute scalping to daily chart swings—with precise, clean level detection across your entire trading history.
- Optional Local Focus: Keep your view focused on price action by limiting visible lines to your immediate trading area.
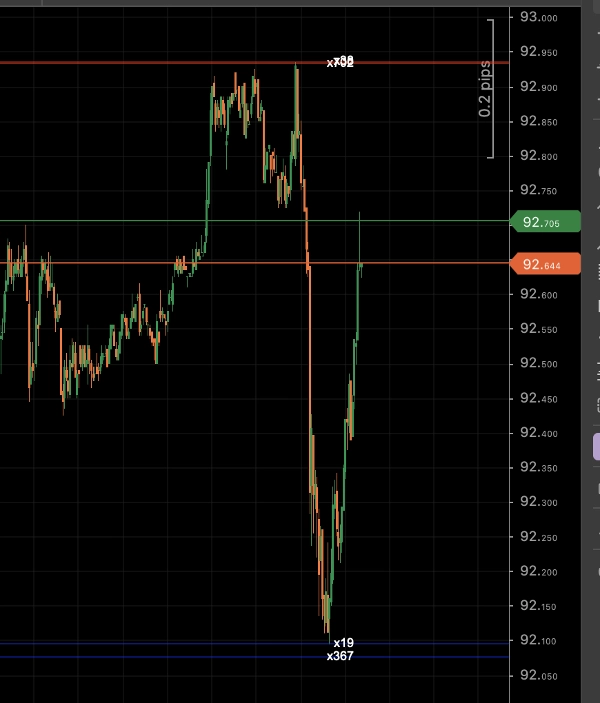
- Historic Strength: Shows the number of times a support or resistance level has been touched.
- Fully Customizable Styling: Adjust colors, line thickness, swing sensitivity, and maximum line counts to match your template setup.
Summary
AI summary
Simple Support and Resistance is a technical indicator that automatically identifies and plots key price turning points on any chart timeframe. It draws clean, ultra-thin support and resistance lines to highlight important market structure levels without cluttering the chart. The indicator features smart clutter filtering that prevents overlapping lines while maintaining high-precision swing points. It supports multiple timeframes, enabling analysis from 1-minute scalping to daily swings, and can focus locally on immediate trading areas by limiting visible lines. The indicator also displays the historical strength of each level by showing how many times it has been touched. Users can fully customize the styling, including colors, line thickness, swing sensitivity, and maximum line counts, to fit their chart setup. This tool is designed to assist traders in visually identifying key market levels for better decision-making across various trading styles and timeframes.
Indicator profile
Indicator category
Support & resistance
Output type
Visualisation
Signals
Data requirements
Bars only
Supported signals
Level break
Reversal
Discussion
Customer reviews
0.0
Reviews: 0
Customer reviews
No reviews for this product yet. Already tried it? Be the first to tell others!
FAQ
Key Levels
MSS
Market Structure
Support & Resistance
Products available through cTrader Store, including trading bots, indicators and plugins, are provided by third-party developers and made available for informational and technical access purposes only. cTrader Store is not a broker and does not provide investment advice, personal recommendations or any guarantee of future performance.


















Price

Since 25/08/2026