Brokers & props
For business
00
Days
:
00
Hours
:
00
Minutes
:
00
Seconds
Chart Overview
Indicator
Version 1.0, Mar 2025
Windows, Mac
Since 23/12/2024
"Chart Overview" uploaded image"Chart Overview" uploaded image"Chart Overview" uploaded image

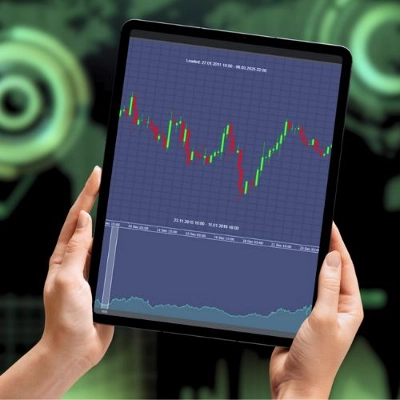
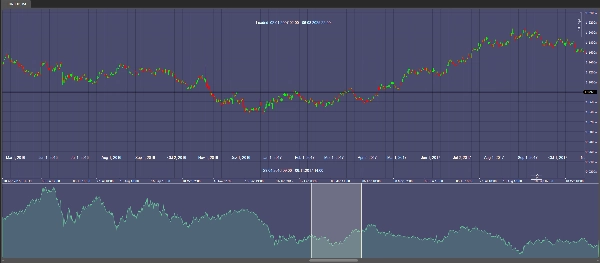
ChartOverview keeps you fully informed of the market’s entire data range, from the earliest to the latest available data point. At the top of your chart, you see a clear display of the complete loaded timeframe, while the current visible period is showcased directly on the chart for real-time insights.

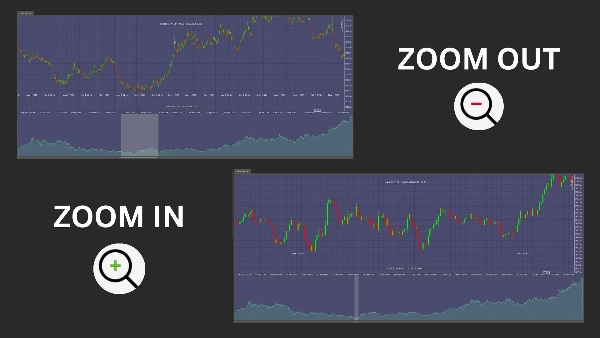
This dynamic indicator updates seamlessly as you scroll, drag, or resize your chart, ensuring you always have up-to-date information. Its intuitive design allows you to quickly identify market trends and opportunities, enhancing your ability to make timely, well-informed trading decisions.

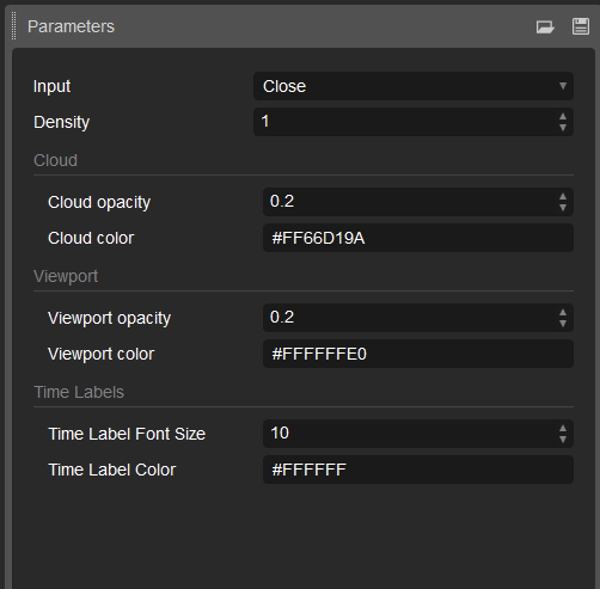
With extensive customization options for colors, opacity, and display settings, ChartOverview integrates perfectly into your personal trading setup. Empower your analysis and gain a competitive edge with a tool designed to deliver a precise and comprehensive market overview.

0.0
Reviews: 0
Customer reviews
No reviews for this product yet. Already tried it? Be the first to tell others!

More from this author

Renko Box Algo
Renko Overlay Algo: Fully Automated Renko Trading with Smart Risk Management

You may also like

Indicator
NAS100
NZDUSD
XAUUSD
+10
ALMA-Gaussian Trend Filter
📈 Adaptive ALMA-Gaussian hybrid trend filter with precision smoothing and clear buy/sell signals.
Indicator
Grid
NAS100
NZDUSD
+15
RangeBoxLevel
This technical analysis indicator provides information on market sentiment, trend and price levels....
Breakout Mode Patterns
Brooks price action breakout mode patterns
TDI_Pro
Traders Dynamic Index (TDI) — Divergence Edition
Wstęgi DoubleSMMA
Wstęgi HTS
Indicator
Fibonacci
Swing Points with Fibonacci Suite
Automated Fibonacci Retracement, Expansion, Fan & Time Zones from unified swing detection. Multi-timeframe capable.
Indicator
NAS100
NZDUSD
XAUUSD
+10
Q Trading Sessions
A visual indicator designed to help traders identify and track market activity across different trading sessions.
Indicator
Indices
ATR
Forex
+1
[Stellar Strategies] Market Regime Filter
Filters market regimes (trend/range/pullback) using MAs, ADX, ATR/BBW Vol, opt. Volume. Helps adapt strategy. 📉📈
Indicator
NAS100
NZDUSD
Martingale
+25
Aggressive Entry Momentum MACD Power Guide
Entry Momentum MACD Power Guide
Indicator
Indices
Commodities
Stocks
+4
IOFXVP
POC Order Blocks Pro: Alpha-Scored IOF Zones
MultiTimeFrameTrend
A compact, visual multi-timeframe trend indicator for cTrader. Easily spot bullish or bearish trends across 4 customizab
Bar Explosion
cTrader indicator with mini-timeframe candlesticks. Customize timeframe, colors, margins. Perfect for traders.