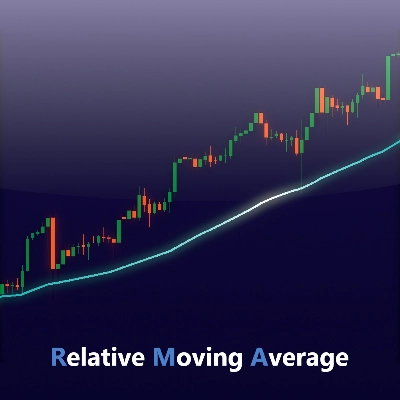
Apresentando o indicador Média Móvel Relativa (RMA), agora disponível para cTrader!
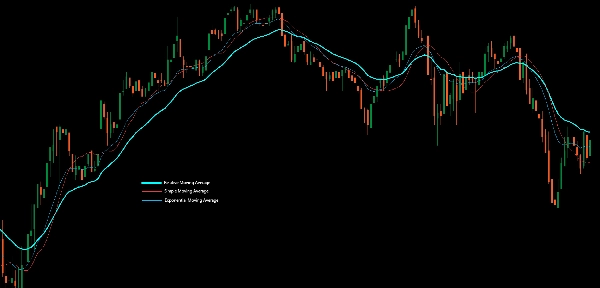
A Média Móvel Relativa (RMA) — também conhecida como Média Móvel Suavizada (SMMA) — é um tipo de média móvel que visa reduzir o atraso mantendo a suavidade na curva. É a mesma fórmula usada pela função “RMA” incorporada do TradingView, amplamente utilizada em indicadores populares como o Índice de Força Relativa (RSI).
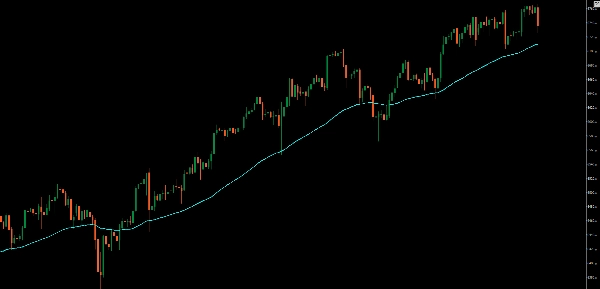
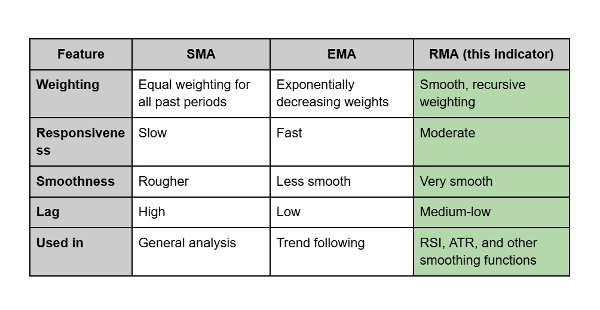
A RMA foi projetada para equilibrar entre responsividade e estabilidade. Ela se atualiza de forma mais suave que uma Média Móvel Exponencial (EMA), mas reage mais rapidamente às mudanças de preço do que uma Média Móvel Simples (SMA).
Como Difere:
- A SMA faz a média de todos os preços igualmente, causando atraso e oscilações bruscas.
- A EMA dá mais peso aos preços recentes, tornando-a muito responsiva, mas às vezes ruidosa.
- A RMA, em contraste, combina os benefícios de ambas: ela suaviza a volatilidade enquanto mantém reações oportunas às mudanças de preço.
Uso Prático:
Os traders frequentemente usam a RMA como uma linha de tendência mais suave ou como parte de indicadores de momentum. É particularmente eficaz quando você quer filtrar ruídos sem introduzir atraso significativo — ideal para confirmar tendências de longo prazo ou apoiar análises de sobrecompra/sobrevenda.


![Logótipo de "[Stellar Strategies] Market Session Ultimate"](https://cdn.ctrader.com/image/webp/61ffd537-0125-4246-9e72-42eca1791d64_28232)


![Logótipo de "High-Low Divergence [Iridio Capital]"](https://cdn.ctrader.com/image/webp/443c4661-7abb-40f1-842f-4b6ec560649b_40914)


