OR Session Zones
Indicador
Versão 1.1, Dec 2025
Windows, Mac
4.5
Avaliações: 2
Descrição
Zonas de Sessão OR — Indicador de Intervalo de Abertura Multi-Sessão
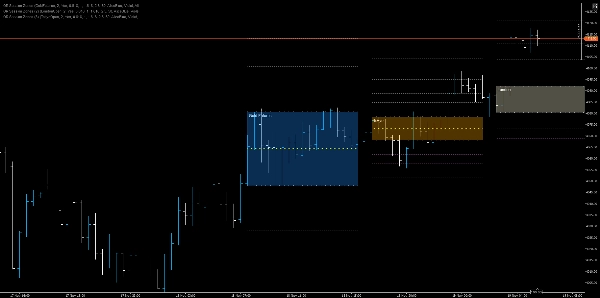
Um indicador de Intervalo de Abertura de alta precisão que detecta aberturas de sessão (NY, Londres, UE, Tóquio, Xangai, futuros de Ouro/Brent), desenha zonas dinâmicas de máximo/mínimo/meio OR, projeta alvos baseados em Fibonacci e pinta uma área sombreada configurável para decisão visual rápida.
Principais características
- Detecção multi-sessão: Suporte nativo para barras de abertura de Nova York, Londres, EuroNext, Tóquio, Xangai, Futuros de Ouro e Futuros de Petróleo usando indicadores de sessão dedicados.
- Cálculo do Intervalo de Abertura: Calcula o Máximo OR e Mínimo OR a partir de um número configurável de velas (RangeCandles) e registra o horário de início da sessão.
- Sobreposições persistentes no gráfico: Desenha linhas de tendência para Máximo OR, Mínimo OR e Meio OR (50%) ao longo do gráfico até um tempo de extensão configurável.
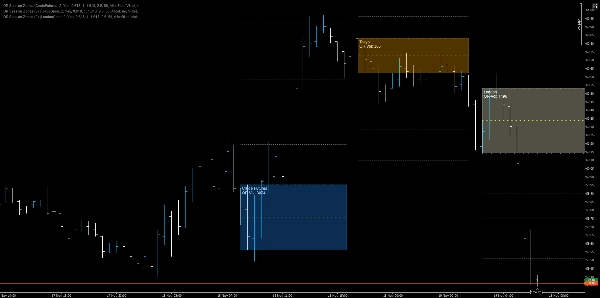
- Zona sombreada: Retângulo preenchido entre Máximo OR e Mínimo OR com opacidade e cor configuráveis por sessão para contexto visual instantâneo.
- Projeções de Fibonacci: Até quatro linhas de projeção R (resistência) e S (suporte) derivadas do intervalo OR com cores independentes e opacidade ajustável.
- Visibilidade flexível: Opção para ocultar ou renderizar IDs de objeto indexados (únicos) para evitar colisões; suporta tanto objetos persistentes únicos quanto objetos por barra quando Ocultar está ativado.
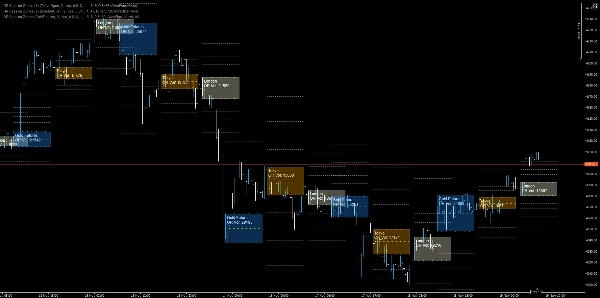
- Codificação de cores da sessão: Cada sessão usa um esquema de cores distinto (ex.: DodgerBlue, LightYellow, Orange, OrangeRed) para tornar a origem da sessão imediatamente óbvia.
Como ajuda os traders
- Contexto rápido: Veja instantaneamente onde o mercado abriu para uma sessão principal e entenda a estrutura inicial do intervalo sem medição manual.
- Gatilhos de decisão: Use quebras do OR, rejeições da linha média e projeções de Fibonacci como regras de entrada/saída ou âncoras para posicionamento de stops.
- Estratégia multi-sessão: Combine ORs sobrepostos (ex.: Londres + NY) para detectar zonas de confluência de sessão e áreas de negociação com maior probabilidade.
- Gestão de risco: Coloque stops atrás de pilhas de OR ou use o meio 50% como alvos dinâmicos de stop/realização de lucro.
Cenários de uso e regras de exemplo
- Entrada por rompimento: Compre no fechamento acima do Máximo OR com confirmação por volume ou momentum; stop logo abaixo do Máximo OR (ou Meio OR para saídas mais apertadas).
- Fade na abertura: Venda perto do Máximo OR com confirmação de reversão se o preço não sustentar acima do Meio OR e mostrar retirada rápida das ofertas.
- Negociação de confluência de sessão: Quando os ORs de Londres e NY se sobrepõem, trate a sobreposição como uma zona de alta confiança de oferta/demanda e ajuste o tamanho da posição conforme.
- Alvos de projeção: Use R1/R2/R3/R4 como níveis escalonados de realização de lucro e S1 - S4 simetricamente para alvos de queda.
Resumo
Perfil do indicador
Avaliações de clientes
4.5
Avaliações: 2
5 | 50 % | |
4 | 50 % | |
3 | 0 % | |
2 | 0 % | |
1 | 0 % |
Avaliações de clientes
November 22, 2025
Solid enough as a backup opinion, and It can look better than it is during a lucky run.
November 19, 2025
Conversa
Perguntas frequentes
Fibonacci
Forex
Breakout
Indices
EURUSD
Commodities
GBPUSD
XAUUSD
NAS100
Os produtos disponíveis através da cTrader Store, incluindo bots de negociação, indicadores e plugins, são fornecidos por programadores terceiros e são disponibilizados apenas para fins informativos e de acesso técnico. A cTrader Store não é um corretor e não fornece aconselhamento em matéria de investimento, recomendações pessoais ou qualquer garantia de desempenho no futuro.


Preço
26
Vendas
2.15K
Instalações gratuitas