
Mô tả
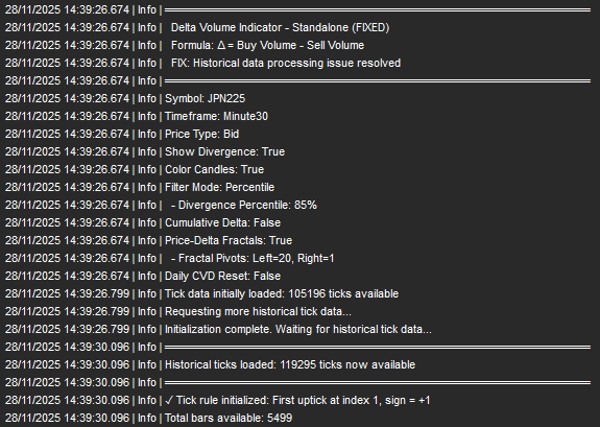
Chỉ báo Delta Volume - Phân tích Dòng Lệnh Nâng cao cho cTrader
Chỉ báo Delta Volume phân tích dòng lệnh từng tick để tiết lộ áp lực mua và bán mà hành động giá đơn thuần không thể hiển thị. Nó tính toán sự khác biệt giữa upticks (mua) và downticks (bán) cho mỗi thanh, cung cấp cái nhìn sâu sắc về sự tham gia thực sự của thị trường.
Phiên bản 1.0
Phiên bản ổn định hiện tại cho các khung thời gian thấp hơn (1m - 15m)
Cập nhật sắp tới!
Điều gì làm nó trở nên độc đáo
Phân tích cấp độ tick thực sự: Không phải ước lượng khối lượng - phân loại tick thực tế
Hệ thống phân kỳ kép: Phát hiện phân kỳ cả ở cấp độ thanh và dựa trên fractal
Xác thực chất lượng: Ước lượng spread Corwin-Schultz đảm bảo tín hiệu đáng tin cậy
Trực quan linh hoạt: Nhiều phương pháp tô màu và tùy chọn lọc
Tùy chỉnh hoàn chỉnh: Mọi màu sắc, ngưỡng và tùy chọn hiển thị đều có thể cấu hình
Dựa trên nghiên cứu: Xây dựng trên nghiên cứu cấu trúc vi mô thị trường được bình duyệt
------------------------------------------------------------------------------------------------------------------------------------------------------------
Tính năng chính
------------------------------------------------------------------------------------------------------------------------------------------------------------
Tính toán Delta Volume
- Phân loại Quy tắc Tick: Mỗi tick được phân loại là mua (+1), bán (-1), hoặc trung tính (0)
- Delta Thanh: Áp lực mua/bán ròng mỗi thanh = Khối lượng mua - Khối lượng bán
- Delta Tích lũy: Tổng cộng chạy cho thấy áp lực định hướng liên tục
- Nhiều loại giá: Tính toán sử dụng giá Bid, Ask hoặc Mid
Phát hiện phân kỳ Delta
Xác định khi giá và dòng lệnh không đồng thuận - tín hiệu đảo chiều tiềm năng.
Hai phương pháp lọc:
- Độ lớn + Mất cân bằng: Ngưỡng trực tiếp cho sức mạnh delta và mất cân bằng khối lượng
- Dựa trên phần trăm: Lọc thích ứng dựa trên phân phối lịch sử
Các dấu hiệu trực quan:
- Tự động đặt tại Điểm Kiểm soát (mức giá có khối lượng cao nhất)
- Kích thước tỷ lệ với độ lớn delta
- Tùy chọn đường xu hướng kéo dài về phía trước
Tô màu nến biểu đồ
Tô màu nến theo dòng lệnh với ba mức ưu tiên:
- Phân kỳ (Vàng) - ưu tiên cao nhất
- Chế độ CVD (tùy chọn) - nhận diện chế độ ổn định
- Delta Thanh (Xanh lục/Đỏ/Xám) - tô màu từng thanh
------------------------------------------------------------------------------------------------------------------------------------------------------------
Phân tích Chế độ CVD
------------------------------------------------------------------------------------------------------------------------------------------------------------
Hai phương pháp tô màu ổn định:
1. Vị trí trong phạm vi
- Hiển thị vị trí CVD trong phạm vi gần đây (0-100%)
- 30% trên = Tăng giá | 30% dưới = Giảm giá | 40% giữa = Trung tính
- Nhanh, trực quan, tự thích ứng
2. Bộ lọc chất lượng Corwin-Schultz
- Sử dụng ước lượng spread Corwin-Schultz thực tế trên giá
- Chỉ tin tưởng CVD khi thanh khoản thị trường cao (spread hẹp)
- Tự động lọc các khoảng thời gian không đáng tin cậy
- Dựa trên nghiên cứu được bình duyệt (Corwin & Schultz 2012)
Nguyên tắc chính: CVD chỉ có ý nghĩa trong các thị trường thanh khoản. Phương pháp này xác thực chất lượng thị trường trước khi hiển thị tín hiệu CVD.
------------------------------------------------------------------------------------------------------------------------------------------------------------
Phân tích Fractal Giá-Delta
------------------------------------------------------------------------------------------------------------------------------------------------------------
Theo dõi đồng thời các điểm pivot trên cả biểu đồ giá và delta tích lũy.
Tính năng:
- Phát hiện fractal cao/thấp với độ dài pivot có thể cấu hình
- Theo dõi tuần tự: theo dõi các đỉnh liên tiếp hoặc đáy liên tiếp
- Phát hiện phân kỳ: so sánh độ dốc giá với độ dốc CVD giữa các pivot
- Trực quan kép: dấu hiệu và đường xu hướng trên cả biểu đồ giá và bảng chỉ báo
- Bộ lọc tùy chọn: Chỉ hiển thị fractal phân kỳ để có cái nhìn sạch sẽ, tập trung
------------------------------------------------------------------------------------------------------------------------------------------------------------
Kết quả trực quan
------------------------------------------------------------------------------------------------------------------------------------------------------------
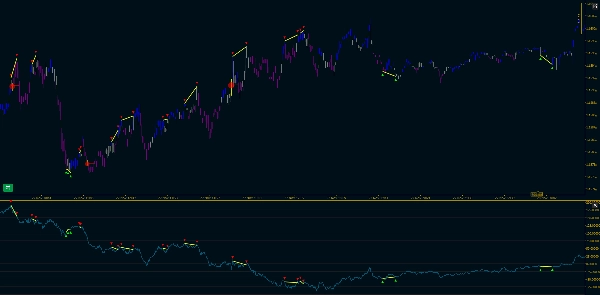
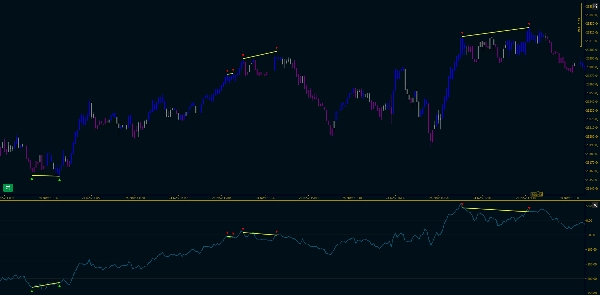
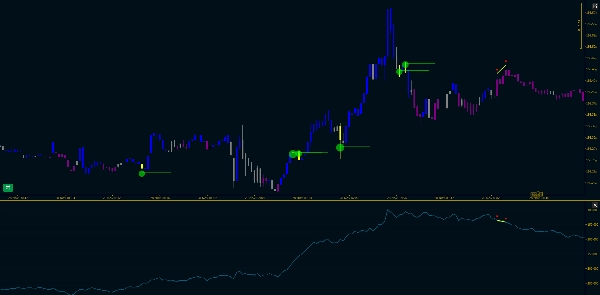
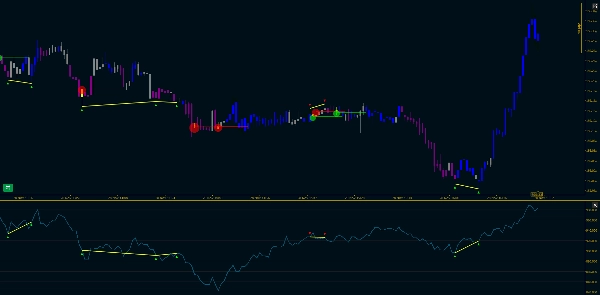
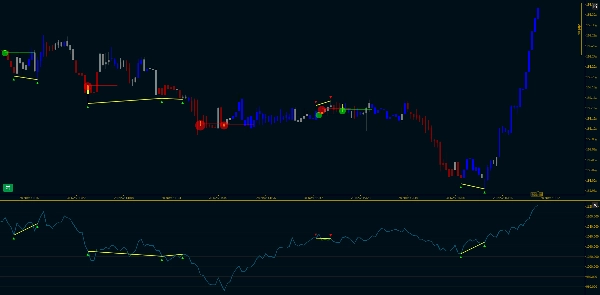
Bảng chỉ báo
- Biểu đồ Delta: Thanh trắng (bình thường), thanh vàng (phân kỳ)
- Đường Delta tích lũy: Đường màu xanh cyan hiển thị dòng lệnh chạy
- Đường tham chiếu số không: Đường chấm xám
- Dấu hiệu Fractal: ▼ (đỉnh) và ▲ (đáy) kèm đường xu hướng
Biểu đồ giá
- Nến được tô màu: Biểu diễn trực quan chế độ dòng lệnh
- Dấu hiệu Fractal: Đồng bộ với bảng chỉ báo
- Đường xu hướng Fractal: Nối các pivot với làm nổi bật phân kỳ
- Dấu hiệu phân kỳ: Vòng tròn tại Điểm Kiểm soát
------------------------------------------------------------------------------------------------------------------------------------------------------------
Tài liệu tham khảo
------------------------------------------------------------------------------------------------------------------------------------------------------------
- Corwin, S. A., & Schultz, P. (2012). "Một cách đơn giản để ước lượng spread Bid-Ask từ giá cao và thấp hàng ngày." The Journal of Finance, 67(2), 719-760.
- López de Prado, M. (2018). Tiến bộ trong Máy học Tài chính, Chương 19.
- Lee, C. M., & Ready, M. J. (1991). "Suy luận hướng giao dịch từ dữ liệu trong ngày." The Journal of Finance, 46(2), 733-746.


