Описание
📈 Trend Master Pro MultiMA – Лучший инструмент для определения тренда 🚀
Этот индикатор отображает 20 скользящих средних с разными периодами (5, 10, 15, 20, 25, 30, 35, 40, 45, 50, 55, 60, 65, 70, 75, 80, 85, 90, 95 и 100). Для каждой из них:
1️⃣ 📊 Выберите тип расчёта: Выбирайте между SMA, EMA, RMA, WMA или VWMA в зависимости от ваших предпочтений. По желанию можно включить сглаживание линейной регрессией для уменьшения шума и более чёткого определения тренда.
2️⃣ 📏 Определите опорный канал: Рассчитывается ценовой канал на основе последних 200 свечей. Ширина канала регулируемая, расширяется при высокой волатильности и сужается в спокойные периоды.
3️⃣ 📈 Сравните скользящие средние с каналом: Каждая скользящая средняя анализируется относительно высоты канала и своих собственных максимумов и минимумов за заданный период (по умолчанию: 20 свечей).
- 📊 Если разница между максимальным и минимальным значением скользящей средней превышает ширину канала, это сигнализирует о сильном тренде (бычьем или медвежьем).
- ⚖️ Если разница находится внутри или близко к каналу, рынок считается нейтральным или флетовым.
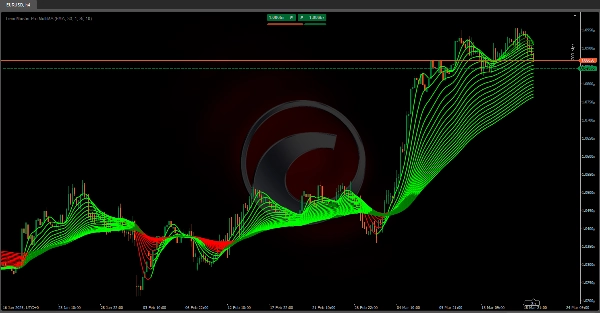
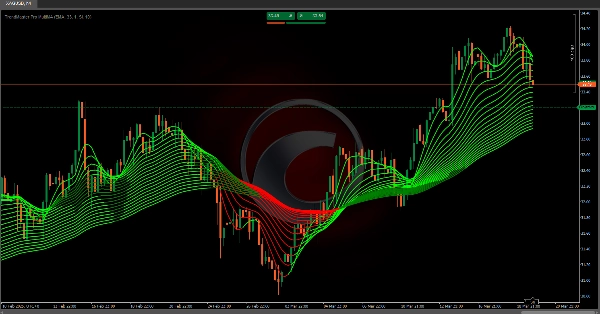
4️⃣ 🎨 Система окраски по тренду: Каждый сегмент скользящих средних окрашивается в зависимости от силы и направления тренда:
- 🟢 Зелёный = Обнаружен бычий тренд
- 🔴 Красный = Обнаружен медвежий тренд
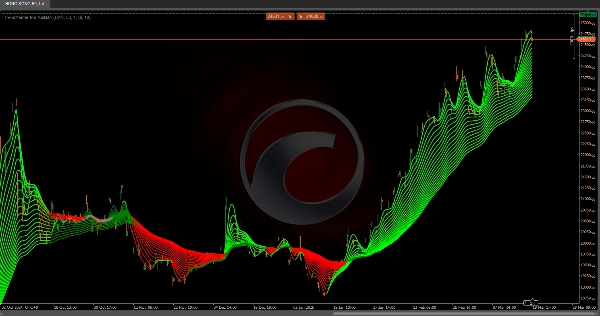
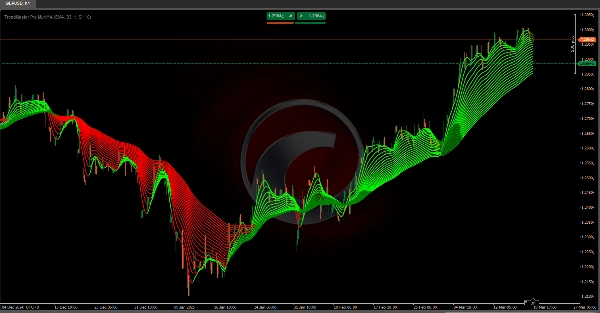
5️⃣ 📉 Визуализация тренда: Индикатор соединяет значения каждой скользящей средней от свечи к свече, формируя веерообразную структуру трендовых линий. Каждая скользящая средняя динамически меняет цвет в зависимости от рассчитанного тренда.
✅ Почему стоит использовать Trend Master Pro MultiMA?
Этот адаптивный многотаймфреймовый подход — объединяющий несколько скользящих средних, ценовые каналы и сглаживание регрессией — помогает быстро определить фазы рынка:
🔹 Бычьи тренды ✅
🔹 Медвежьи тренды ❌
🔹 Флет/боковое движение 🔄
🚀 Идеально подходит для трейдеров, ищущих чёткие визуальные подсказки для принятия лучших решений на коротких, средних и длинных таймфреймах! 📊🔥
Индикаторы Ctrader Store:
Dynamic Market Structure
Analysis of Turning Points
Fibonacci Linear
Regression Multi-timeframe
Multi-Level Candle Bias
Tracker
Auto Support and
Resistance Trend Lines
Сводка
Each moving average is compared against this channel and its own highs and lows over a defined period (default 20 candles). If the range of a moving average exceeds the channel width, it signals a strong bullish or bearish trend; if within or near the channel, the market is considered neutral or ranging. The indicator visually represents trends by connecting moving average values candle-to-candle, forming a fan-like structure of trendlines. Trend strength and direction are indicated by color coding: green for bullish and red for bearish trends.
This multi-timeframe adaptive tool integrates multiple moving averages, price channels, and regression smoothing to help traders quickly identify market phases—bullish, bearish, or ranging—across short, medium, and long-term timeframes.
Отзывы покупателей
5 | 100 % | |
4 | 0 % | |
3 | 0 % | |
2 | 0 % | |
1 | 0 % |