Keltner Channels advanced
Indicador
Versión 1.0, Apr 2026
Windows, Mac
5.0
Valoraciones: 1
Descripción
Sistema Avanzado de Nubes y Rupturas de Canales Keltner
Los Canales Keltner estándar son una herramienta fantástica para leer la volatilidad y la dirección de la tendencia, pero trazar líneas simples en un gráfico es solo el comienzo.
El Keltner Avanzado lleva este indicador clásico a un nivel completamente nuevo. Al introducir un Sistema de Nube de Banda Dual, Detección de Compresión de Ancho de Banda y Barras Pintadas Inteligentes, transforma un canal simple en un sistema de trading visual completo para traders de rupturas y seguimiento de tendencias.
Características Clave
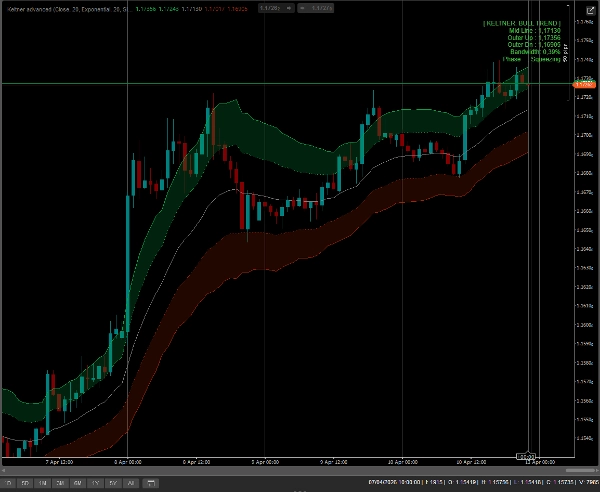
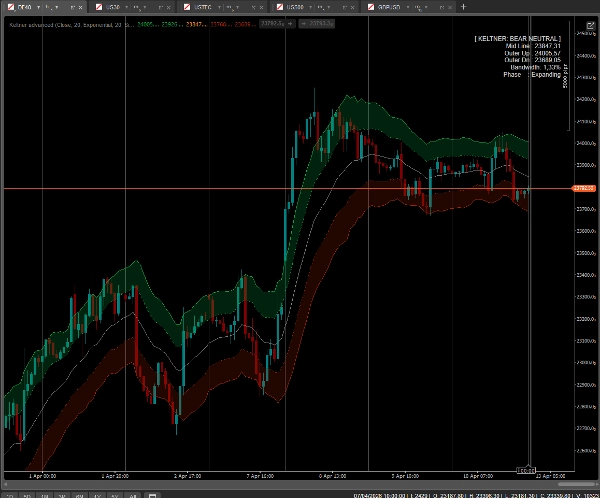
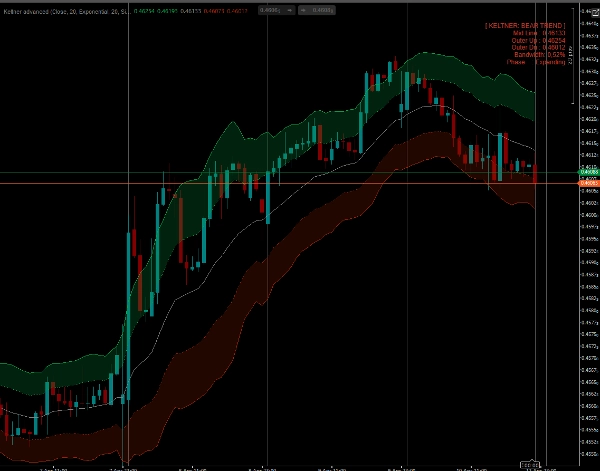
- Sistema de Nube de Banda Dual (Zonas de Acción): En lugar de un canal, este indicador traza una Banda Interior y una Banda Exterior. El espacio entre ellas se llena con una Nube dinámica.
-
- ¿Precio dentro de la Nube? Estás en un "Viaje de Tendencia" fuerte y saludable.
- ¿Precio entre la Línea Media y la Banda Interior? Estás en una fase de retroceso / reversión a la media.
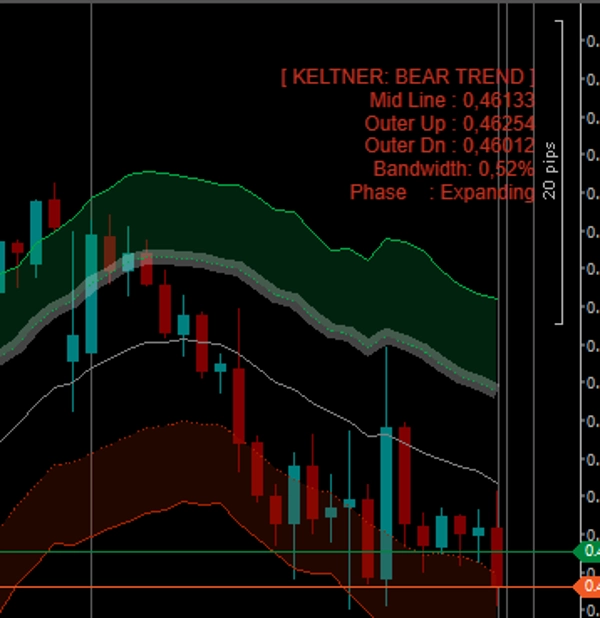
- Coloración Inteligente de Barras (Paintbars): Tus velas cambiarán de color según su ubicación exacta dentro de la estructura del canal:
-
- Verde/ Rojo Neón (Extremo): El precio rompe fuera de la Banda Exterior. ¡Impulso masivo o clímax!
- Verde/ Rojo Brillante (Tendencia): El precio se mueve dentro de la Nube Keltner.
- Verde/ Rojo Oscuro (Retroceso): El precio retrocede hacia la Línea Media.
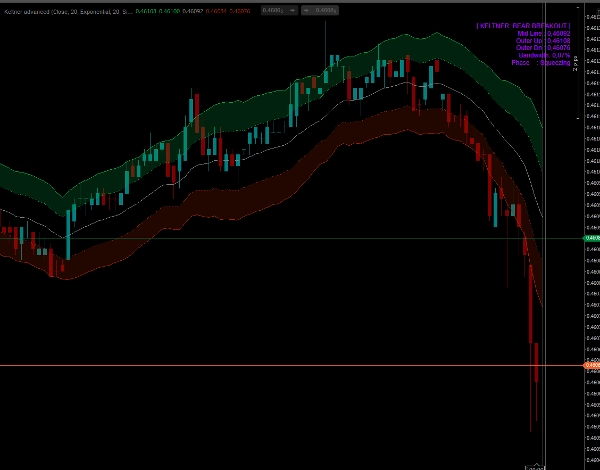
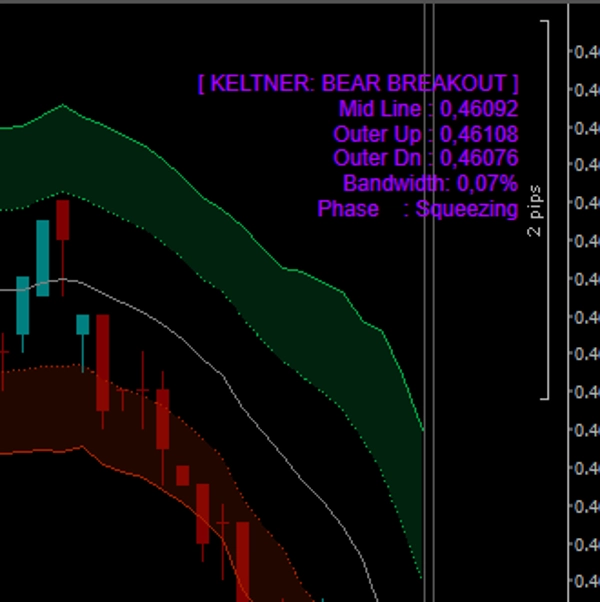
- Detección de Compresión de Ancho de Banda: El indicador calcula constantemente el ancho del canal y lo compara con las barras anteriores. El panel te indicará exactamente si el mercado está comprimiéndose (preparándose para una ruptura) o expandiéndose.
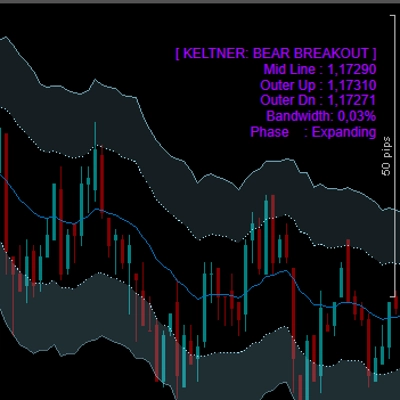
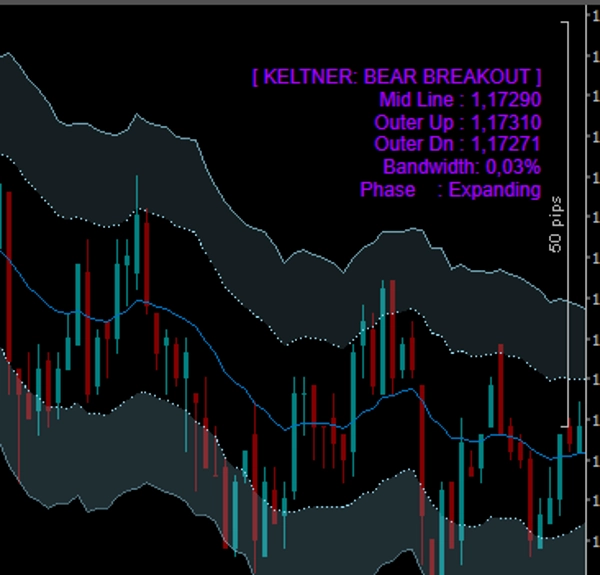
- Panel en Tiempo Real en el Gráfico: Un panel elegante y no intrusivo muestra el Estado Actual del Mercado (Tendencia Alcista, Ruptura Bajista, Neutral, etc.), niveles exactos de Banda, porcentaje de Ancho de Banda y Fase de Volatilidad.
- Completamente Desbloqueado: Opera en CUALQUIER símbolo (Forex, Cripto, Índices, Acciones) y CUALQUIER marco temporal sin limitaciones. Acceso de por vida.
¿Cómo operar con él?
- La Ruptura: Observa el panel para una fase de "Compresión". Cuando el precio explota fuera de la Banda Exterior y las velas se pintan de Verde o Rojo Neón, opera la ruptura con fuerte impulso.
- Seguir la Tendencia: Una vez establecida la tendencia, mantente en tu operación mientras las velas estén pintadas de Verde o Rojo Brillante y "deslicen" dentro de la Nube.
- Comprar en la Caída: Cuando el precio retrocede a la Línea Media naranja (las velas se vuelven verde oscuro), a menudo presenta una entrada de bajo riesgo para unirse a la tendencia principal.
Resumen
Perfil del indicador
Categoría del indicador
Volatilidad
Tipo de resultado
Visualización
Señales
Filtro
Requisitos de datos
Únicamente barras
Señales admitidas
Fuerza de la tendencia
Volatilidad
Ruptura
Valoraciones de clientes
5.0
Valoraciones: 1
5 | 100 % | |
4 | 0 % | |
3 | 0 % | |
2 | 0 % | |
1 | 0 % |
Conversación
Preguntas frecuentes
Key Levels
Channel
Los productos disponibles a través de cTrader Store, incluidos bots, indicadores y plugins para operar, son proporcionados por desarrolladores de terceros y están disponibles únicamente con fines informativos y de acceso técnico. cTrader Store no es un bróker, por lo que no proporciona asesoramiento de inversión, recomendaciones personales ni ninguna garantía de rentabilidad futura.


Precio
24
Ventas
710
Instalaciones gratis