


Descrição
O que faz
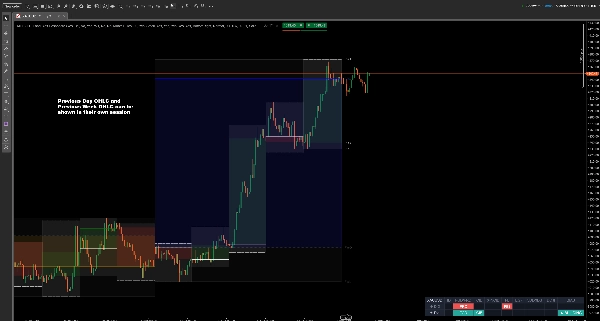
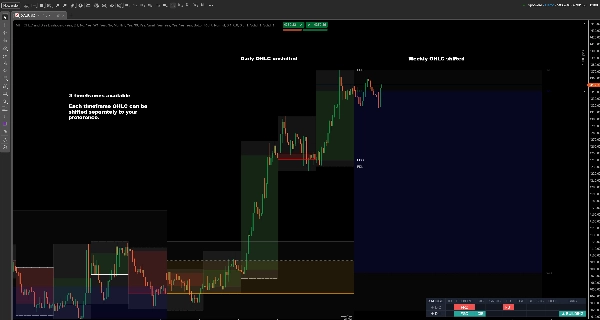
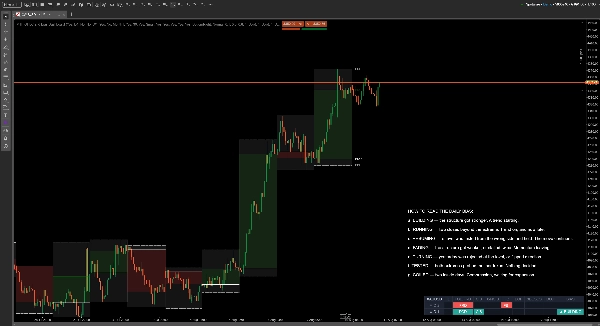
MULTI-TIMEFRAME OHLC e PAINEL DE VIÉS é um indicador de ação de preço multi-temporal para cTrader. Ele desenha os níveis OHLC do dia anterior, semana anterior e mês anterior — abertura, máxima, mínima e fechamento — no seu gráfico, e adiciona um painel que lê o que o preço realmente fez nesses níveis nos últimos dois dias completos.
Máxima e mínima do dia anterior (PDH e PDL), a abertura diária, a máxima e mínima semanal: esses são os níveis de suporte e resistência de prazos maiores que a maioria dos traders intradiários e swing já utiliza. O que eles geralmente fazem a olho todas as manhãs é compará-los — o fechamento de ontem foi acima do dia anterior? O preço ultrapassou a máxima do dia anterior e falhou? O movimento está se formando ou ficando sem espaço? Este indicador responde a essas perguntas no gráfico, em uma linha.
Níveis OHLC multi-temporais
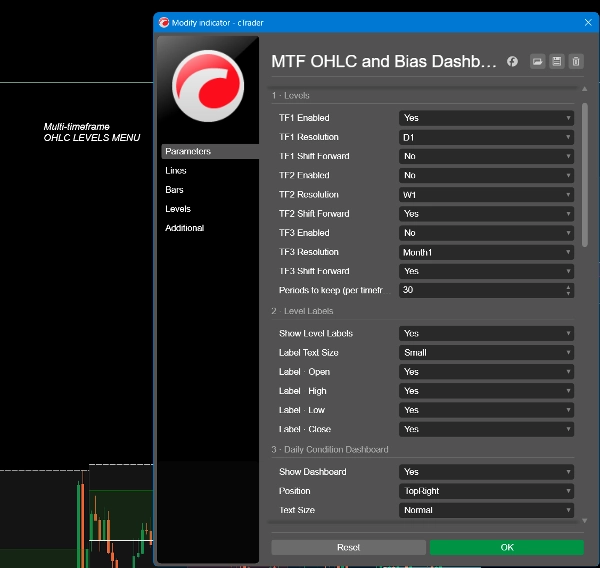
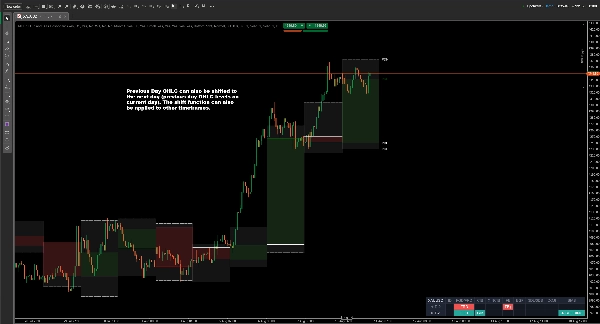
Até três prazos ao mesmo tempo — diário, semanal, mensal, ou qualquer resolução que você escolher. Cada um desenha sua abertura, máxima, mínima e fechamento, com um corpo sombreado opcional e uma faixa de máxima a mínima. Os níveis podem ser deslocados para frente para que a referência do período atual fique à frente do preço em vez de atrás, e você pode manter até 70 períodos históricos no gráfico.
Cada linha tem sua própria cor, espessura e estilo, assim um nível de suporte semanal nunca se confunde com um diário.
O painel de condição diária
O painel avalia as últimas duas velas diárias completas — D-1 (ontem) e D-2 (anteontem) — cada uma em relação ao dia que a precedeu.
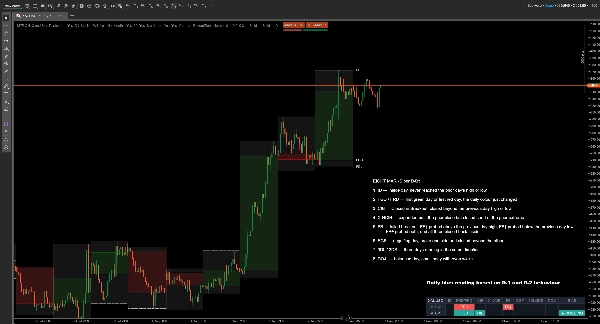
Nove marcas por dia:
- ID — dia interno, nunca alcançou a máxima ou mínima do dia anterior
- FGD / FRD — primeiro dia verde ou primeiro dia vermelho, a cor diária acabou de mudar (Verde é dia de alta e Vermelho é dia de baixa)
- CIB — Fechou em rompimento, fechou além da máxima ou mínima do dia anterior
- X-NCIB — expandiu além do fechamento anterior mas fechou antes do extremo anterior (Expand Not Closed In Breakout = X-NCIB)
- FB — rompimento falhou: FB↑ testou acima da máxima do dia anterior, FB↓ testou abaixo da mínima do dia anterior, FB± testou ambos, e todos os três fecharam de volta dentro
- EGF — dia engolfante, rompeu um lado e fechou além do outro
- 3DL / 3DS — três dias seguidos na mesma direção (3 Dias de Alta = 3DL / 3 Dias de Baixa = 3DS)
- DOJI — dia equilibrado, corpo pequeno com pavios iguais
- VIÉS — a leitura, explicada abaixo
Como ler o viés diário
O viés é a parte que economiza seu trabalho. Cada dia se resume a um único estado, e o viés vem do movimento entre D-2 e D-1 — não apenas de ontem. A mesma marca significa coisas diferentes dependendo do que a precedeu, e isso é exatamente o que um painel de um único dia não pode dizer.
- CONSTRUINDO — a estrutura ficou mais forte. Uma tendência começando.
- EM MOVIMENTO — dois fechamentos além do extremo. Tendência ativa, e agora atrasada.
- RETOMANDO — um nível foi testado pelo lado errado e resistiu. O movimento continua.
- DESVANECENDO — a estrutura enfraqueceu, ou parou duas vezes. Momentum saindo.
- VIRANDO — ontem foi rejeitado no nível, ou mudou de direção.
- TESTADO — ambos os extremos testados, nenhum tomado. Nada decidido.
- ENROLADO — dois dias internos. Compressão, esperando expansão.
Uma seta e cor indicam a direção: verde para cima para alta, vermelho para baixo para baixa, cinza neutro quando não há direção a indicar.
Ambas as linhas de detalhes permanecem visíveis acima do viés, para que você sempre possa ver por que ele lê do jeito que lê, em vez de confiar em uma caixa preta.
Uso típico
Abra o gráfico pela manhã, leia o viés, e saiba antes da sessão começar se você está procurando continuação, um desvanecimento ou uma faixa. Então negocie seus próprios setups contra os níveis desenhados — a máxima e mínima do dia anterior, a abertura diária, os extremos semanais.
É adequado para trabalho de faixa de abertura, negociação de rompimentos falhados e estratégias de continuação dia a dia. Útil em forex, índices, metais e cripto.
Configurações
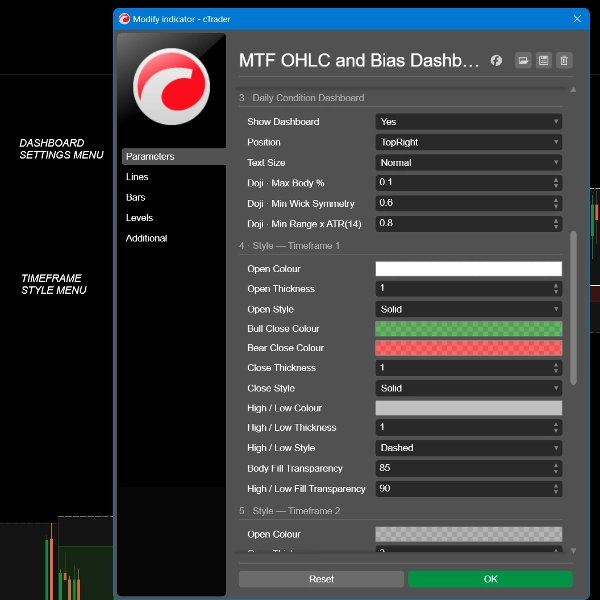
- Três slots de timeframe independentes, cada um com sua própria resolução, alternância de deslocamento para frente e controles completos de cor, espessura e estilo
- Número de períodos históricos a manter, até 70
- Rótulos de nível ligados ou desligados, por tipo de linha, com tamanho de texto ajustável
- Painel ligado ou desligado, cinco posições na tela, quatro tamanhos de texto
- Sensibilidade Doji: porcentagem máxima do corpo, simetria mínima dos pavios, alcance mínimo relativo à média de 14 dias
******************************************************
Para quem é
Traders intradiários e swing que já trabalham com níveis do dia anterior e da semana anterior. Assume que você sabe o que é uma máxima do dia anterior e por que ela importa. Se esses níveis não fazem parte do seu modo de operar, isso não vai te ensinar a usá-los.
O que não faz
Ser claro sobre isso agora nos poupa tempo depois:
- Não fornece sinais de compra ou venda, nem preços de entrada ou saída
- Não faz ordens e não pode acessar sua conta — o indicador roda sem nenhum direito de acesso
- Não tem alertas ou notificações
- Não prevê nada. Cada marca descreve velas que já fecharam
- Não repinta. O painel lê apenas velas diárias completas, então uma leitura nunca muda depois do fato
- Não é uma estratégia. O viés descreve a estrutura; não recomenda uma negociação
********************************************************
Coisas que vale saber
O painel precisa de pelo menos quatro velas diárias completas, então um símbolo recém-listado mostrará traços até ter histórico suficiente.
Velas diárias começam no horário do servidor do seu corretor. Dois corretores no mesmo instrumento podem cortar o dia em horas diferentes, o que significa que o mesmo símbolo pode legítima e diferentemente ser lido em duas plataformas. Isso é uma propriedade dos dados, não uma falha do indicador.
Acima do timeframe diário o painel não consegue ler dados diários e mostra um aviso TF > D. Os níveis ainda são desenhados.
Negociar envolve risco. Desempenho passado não garante resultados futuros.
Resumo
A central feature is the two-day price action bias dashboard, which analyzes the last two completed daily candles relative to their preceding days. It categorizes daily price behavior into nine distinct patterns (e.g., inside day, first green/red day, failed breakout, engulfing day) and summarizes the overall bias into states such as building, running, fading, or turning. Directional bias is indicated with colored arrows (green for bullish, red for bearish, grey for neutral), helping traders quickly assess market structure without guesswork.
Designed for intraday and swing traders familiar with previous day and week levels, the indicator does not provide trade signals, alerts, or order execution. It is suitable for forex, indices, metals, and cryptocurrencies, aiding strategies like opening-range, failed-breakout, and continuation trading by clearly marking key levels and daily price action context.
Conversa
Avaliações de clientes
Perguntas frequentes
Mais deste autor




















Preço