Description
Harmonic Strategy Suite Pro
La plupart des indicateurs harmoniques dessinent un motif et vous laissent deviner s'il vaut
la peine de trader. Celui-ci répond à cette question : chaque motif qu'il trouve est
rejoué contre l'historique du graphique lui-même, vous voyez donc le taux de réussite réel de chaque
type de motif sur l'instrument et la période devant vous - avant de risquer
quoi que ce soit.
Ce qu'il analyse
L'indicateur fonctionne uniquement à partir de la structure des prix - pas d'indicateurs superposés
sur des indicateurs, pas de repeinture des motifs confirmés.
Un moteur de pivot original balaie le graphique sur toute une gamme de profondeurs de swing
à la fois, il capture donc des structures à plusieurs échelles au lieu de seulement celle
que vos réglages favorisent. Les pivots consécutifs dans la même direction sont fusionnés jusqu'à
l'extrême véritable, donnant une séquence propre alternant haut-bas-haut.
Chaque fenêtre consécutive de cinq pivots (X-A-B-C-D) est ensuite mesurée par rapport aux
définitions publiées de Fibonacci de six motifs harmoniques classiques :
Gartley B à 0.618 de XA, D à 0.786
Bat B à 0.382-0.50, D à 0.886
Butterfly B à 0.786, D à 1.272-1.618
Crab B à 0.382-0.618, D à 1.618
Shark B à 1.13-1.618, D à 0.886-1.13
Cypher B à 0.382-0.618, C à 1.272-1.414, D à 0.786
Un réglage de tolérance contrôle la rigueur avec laquelle ces ratios doivent être respectés, et chaque
détection est notée de 0 à 100 selon sa proximité avec le ratio idéal - ainsi un
Gartley conforme au manuel est visiblement distingué d'un motif plus lâche.
Le backtester - ce qui rend ceci différent
C'est la partie que la plupart des outils harmoniques n'ont pas.
Pour chaque motif trouvé, l'indicateur simule le trade que ce motif aurait
produit :
- Un ordre limite est placé au point d'achèvement D.
- Si le prix atteint la cible ou le stop AVANT de toucher D, la configuration est
considérée comme invalidée et ne devient jamais un trade - exactement comme un
ordre en attente réel serait annulé.
- Les ordres non remplis expirent après 15 barres.
- Les trades remplis sont ensuite suivis barre par barre pour voir s'ils ont atteint
la cible 1, la cible 2, ou le stop en premier.
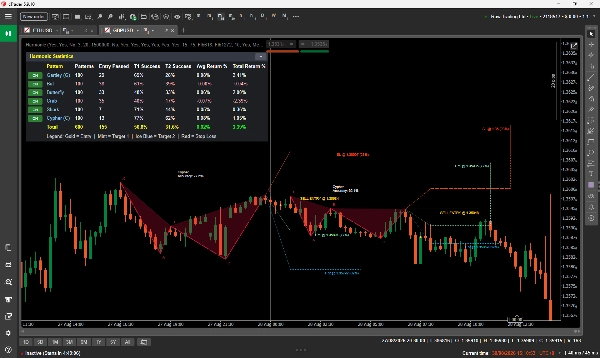
Ces résultats sont compilés dans un tableau de bord sur le graphique montrant, par type de motif :
Motifs trouvés | Entrées remplies | Taux de réussite Cible 1 | Taux de réussite Cible 2 |
Rendement moyen | Rendement total
avec une ligne totale combinée. Les lignes perdantes sont mises en évidence, et chaque type de motif
dispose d'un bouton ON/OFF qui le filtre instantanément hors du graphique. Le panneau
se replie en une seule barre de titre lorsque vous souhaitez une vue dégagée.
Vous pouvez voir en un coup d'œil que, par exemple, Cypher se remplit rarement mais convertit
souvent sur cette paire, tandis que Crab se remplit plus et convertit moins. C'est un
jugement sur lequel vous pouvez agir - et il est mesuré sur les données de votre courtier, pas
cité d'un livre.
Comment lire le graphique
Chaque motif est dessiné comme son squelette X-A-B-C-D avec des triangles ombrés. L'
ombrage n'est pas décoratif : plus ce type de motif a atteint la Cible 1 dans
le backtest, plus son remplissage est solide, ainsi les structures fiables ressortent
immédiatement.
Chaque motif porte son plan de trade complet :
Ligne d'entrée dorée, étiquetée BUY ENTRY / SELL ENTRY avec le prix exact
Cible 1 menthe, étiquetée avec le prix et le taux de réussite T1 de ce motif
Cible 2 bleu glace, même traitement
Stop loss rouge
Le style de ligne vous indique ce qui s'est passé. Un niveau que le prix a réellement atteint est
dessiné SOLIDE et s'arrête à la barre où il a été touché. Un niveau jamais atteint
reste POINTILLÉ et court jusqu'à la fin de la configuration. Un point doré marque la
barre de confirmation. Les étiquettes se situent à la fin de leur propre ligne, avec un trait de liaison dessiné
chaque fois qu'il faut les décaler pour rester lisibles.
Le nom du motif et sa précision sont imprimés à côté de chaque structure, positionnés sous
les configurations haussières et au-dessus des baissières pour ne jamais se superposer à l'action des prix.
Réglages clés
Inclure les motifs haussiers / baissiers Filtre de direction de trade
Activer Gartley ... Activer Cypher Désactiver complètement certains motifs
Recherche de pivot Profondeur min / max Plage de sensibilité du swing (3-20). Un
minimum plus élevé trouve moins de structures, mais plus grandes
Structures
Erreur autorisée sur ratio Fib % Tolérance du ratio. 15% est un
défaut équilibré ; baissez-le pour des détections strictement conformes au manuel
Détections
Distance Stop Loss Placement du stop au-delà de D, en pourcentage
de la plage AD
Cible 1 / Cible 2 Ratio Multiples de Fibonacci de AD
Barres historiques à scanner Profondeur du scan et donc
taille de l'échantillon statistique
Nombre maximal de motifs à dessiner Clarté du graphique vs exhaustivité
Afficher le tableau de bord Statistiques du tableau de bord activé/désactivé
Couleurs et taille de police Contrôle visuel complet
À qui cela s'adresse
Adapté aux traders qui comprennent déjà les motifs harmoniques et veulent
automatiser le travail fastidieux avec des preuves à l'appui - et aux traders intermédiaires qui
connaissent les formes mais ne savent pas lesquelles croire.
Il est vraiment utile pour les traders swing et intraday sur tout instrument et toute
période : forex, indices, matières premières et crypto fonctionnent tous, car la logique
est pure géométrie des prix.
Si vous n'avez jamais rencontré un motif harmonique auparavant, lisez d'abord les bases.
L'indicateur les trouvera pour vous, mais il suppose que vous savez ce qu'un Gartley essaie
de vous dire.
Utilisation typique
1. Attachez-le à un graphique et laissez le tableau de bord construire son échantillon.
2. Regardez quels types de motifs performent réellement sur cet instrument et
cette période, et désactivez les faibles.
3. Attendez une nouvelle complétion en D, en vérifiant le score de précision et le
taux de réussite historique de ce type.
4. Utilisez l'entrée, le stop et les cibles dessinés comme plan, dimensionnés selon votre propre risque.
Notes importantes - veuillez lire
- Ceci est un OUTIL D'ANALYSE. Il ne place, ne modifie ni ne clôture aucun ordre.
Il n'y a pas de trading automatique et il ne touche jamais à votre compte.
- Les performances passées ne sont pas une prédiction. Le tableau de bord rapporte ce que ces
motifs ont fait historiquement sur les données chargées. C'est une preuve pour une
décision, pas une garantie pour la suivante.
- Les statistiques ont besoin d'un échantillon. cTrader ne donne à un indicateur que les barres que
le graphique a réellement chargées, donc faites défiler vers l'arrière pour charger l'historique avant de juger
les chiffres - la différence entre quelques centaines de barres et plusieurs
milliers est la différence entre le bruit et un échantillon utilisable.
- Les rendements sont affichés en pourcentage du prix. Une paire forex montrera naturellement
des pourcentages plus petits qu'un indice ou une matière première ; comparez ce qui est comparable.
- Les taux de remplissage des entrées sont volontairement bas. Beaucoup de configurations harmoniques
ne se remplissent jamais car le prix s'éloigne d'abord de D. L'indicateur compte
cela honnêtement comme non rempli plutôt que de flatter les statistiques.
- Les scans profonds font un vrai travail. Si vous poussez le nombre de barres haut sur une machine lente
et voyez une pause à chaque nouvelle barre, réduisez les Barres Historiques à Scanner ou augmentez
la profondeur minimale du pivot.
Analyse uniquement. Pas de DLL. Pas de connexions externes. Il n'envoie, ne modifie ni ne
clôture jamais un ordre.
Résumé
A key feature is its integrated backtester, which simulates trades for each pattern found on the chart’s historical data. It places hypothetical limit orders at pattern completion points (D), tracks whether targets or stops are hit, and accounts for unfilled orders and invalidated setups. Results are summarized in an on-chart dashboard showing statistics such as patterns found, entries filled, hit rates for two targets, average and total returns per pattern type, with options to filter patterns on or off.
Patterns are visually displayed with their X-A-B-C-D structure, trade entry, stop loss, and target levels, using line styles and shading to indicate historical success rates and trade outcomes. The indicator supports customization of pattern inclusion, pivot sensitivity, Fibonacci ratio tolerance, stop and target distances, and visual settings.
Designed for traders familiar with harmonic patterns, it suits swing and intraday trading across instruments and timeframes including forex, indices, commodities, and crypto. It functions solely as an analysis tool without order execution capabilities.