

الوصف
Vice TrendTrading
"مناطق الاتجاه المتقدمة وسهام الدخول الدقيقة مدعومة بمنطق الاتجاه متعدد الأطر الزمنية"
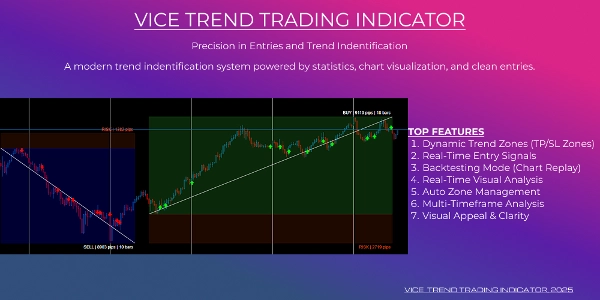
هذا ليس مجرد مؤشر اتجاه آخر — إنه نظام تداول بصري كامل مصمم لمساعدتك على اكتشاف اتجاه السوق، تتبع أداء السوق في الوقت الحقيقي، و تحليل نتائج الاتجاه بوضوح.
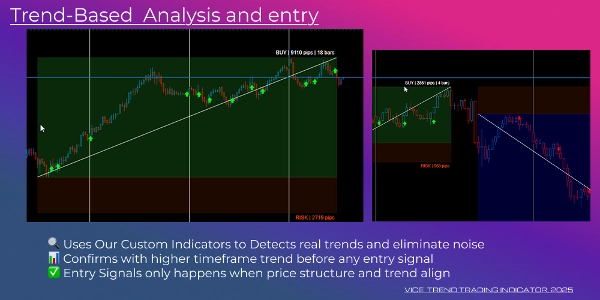
يجمع هذا الأداة المتقدمة بين تحليل الاتجاه متعدد الأطر الزمنية، تراكبات الربح/الخسارة في الوقت الحقيقي، و سهام الإشارة التلقائية في تجربة رسم بياني واحدة نظيفة وقوية.
الميزات الرئيسية:
1. مناطق الاتجاه الديناميكية (مظاهر TP/SL)
الملخص
ملخص الذكاء الاصطناعي
Vice TrendTrading is a comprehensive visual trading indicator designed to identify and track market trends using multi-timeframe analysis. It provides dynamic trend zones that visually mark entry areas, take profit targets, and stop loss levels with high precision. These zones update in real time, displaying profit and loss metrics in dollars, pips, and percentages.
The system includes automatic signal arrows that confirm valid buy and sell entries within active trend zones, ensuring signals appear only at valid entry points without repainting or duplication. It supports historical signal reconstruction for chart replay, allowing users to visually backtest and analyze past market behavior accurately.
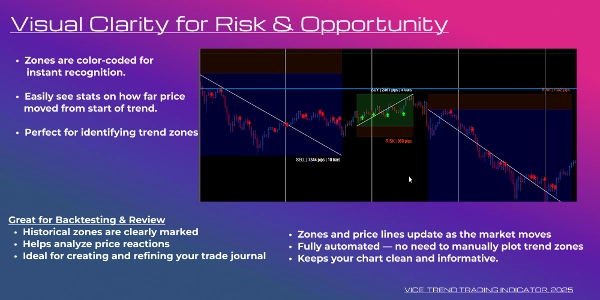
Vice TrendTrading manages trend zones automatically by closing and labeling completed zones when trends reverse, maintaining clean and organized charts even in volatile conditions. The indicator features color-coded zones and arrows with annotated profit/loss values for clarity and ease of interpretation.
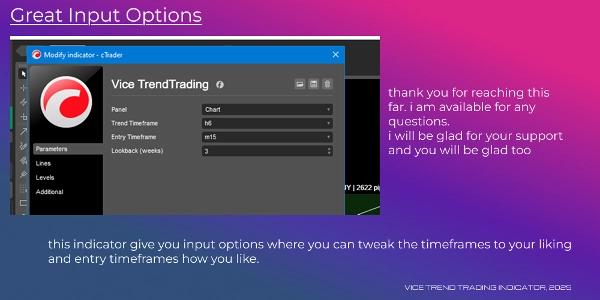
It works on all symbols and any timeframe, with customizable input parameters for trend and entry timeframes. This tool is suited for price action traders, discretionary traders, strategy developers, and anyone seeking a structured, modern chart to make informed trading decisions.
The system includes automatic signal arrows that confirm valid buy and sell entries within active trend zones, ensuring signals appear only at valid entry points without repainting or duplication. It supports historical signal reconstruction for chart replay, allowing users to visually backtest and analyze past market behavior accurately.
Vice TrendTrading manages trend zones automatically by closing and labeling completed zones when trends reverse, maintaining clean and organized charts even in volatile conditions. The indicator features color-coded zones and arrows with annotated profit/loss values for clarity and ease of interpretation.
It works on all symbols and any timeframe, with customizable input parameters for trend and entry timeframes. This tool is suited for price action traders, discretionary traders, strategy developers, and anyone seeking a structured, modern chart to make informed trading decisions.
ملف تعريف المؤشر
مناقشة
تقييمات العملاء
4.6
التقييمات: 3
5 | 67 % | |
4 | 33 % | |
3 | 0 % | |
2 | 0 % | |
1 | 0 % |
تقييمات العملاء
July 18, 2025
Two sessions say more than one clean chart, and the market read feels cleaner.
July 15, 2025
not perfect, but the workflow felt cleaner, and A small account test feels safer.
July 7, 2025
Not perfect, but the workflow felt cleaner. It needs a few bad trades in the sample too.
الأسئلة الشائعة
يتم توفير المنتجات المتاحة من خلال cTrader Store، بما في ذلك روبوتات التداول والمؤشرات والإضافات، من قبل مطوري الطرف الثالث وإتاحتها لأغراض الوصول المعلوماتي والفني فقط. cTrader Store ليس وسيطًا ولا يقدم نصائح استثمارية أو توصيات شخصية أو أي ضمان للأداء المستقبلي.


















السعر

منذ 17/06/2025