説明
BLOCK LIQUIDITYインジケーターは、市場分析の2つの主要なアプローチを組み合わせています:
オーダーブロック検出:
ルックバック期間内の破られていない高値と安値に基づいてサポートとレジスタンスのエリアを特定します。
価格が破られていない安値を上回って終値をつけたときに買いシグナルを生成します。
価格が破られていない高値を下回って終値をつけたときに売りシグナルを生成します。
流動性分析:
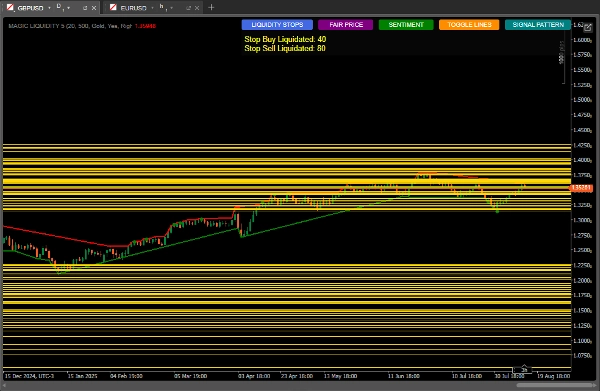
流動性プール(ストップロスが集中している可能性のあるエリア)を検出します。
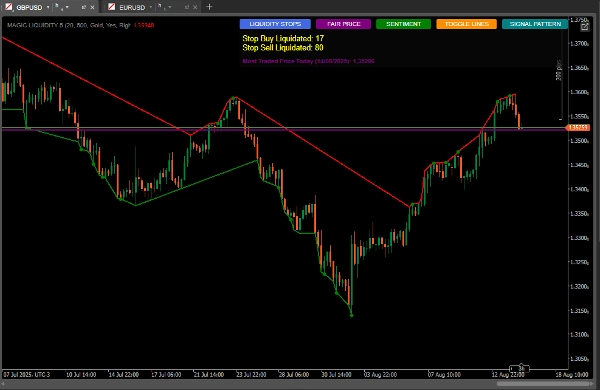
買いおよび売りのストップの発動を監視します。
流動性の分布に基づいて市場センチメントを計算します。
最も取引された価格(フェアプライス)を特定します。
最良の結果を得るための使い方
初期設定
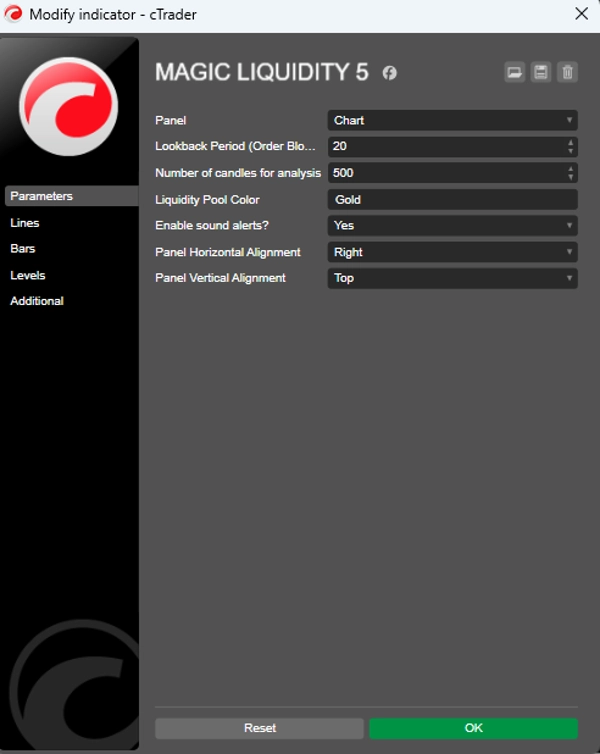
ルックバック期間:取引している時間枠に応じて「Lookback Period」パラメーターを調整してください(時間枠が大きいほど値を大きくします)。
分析用のキャンドル数:堅牢な分析には500のままにするか、より速い反応が必要な場合は減らしてください。
流動性プールの色:チャート上で目立つ色を選択してください。
シグナルの解釈
オーダーブロックシグナル:
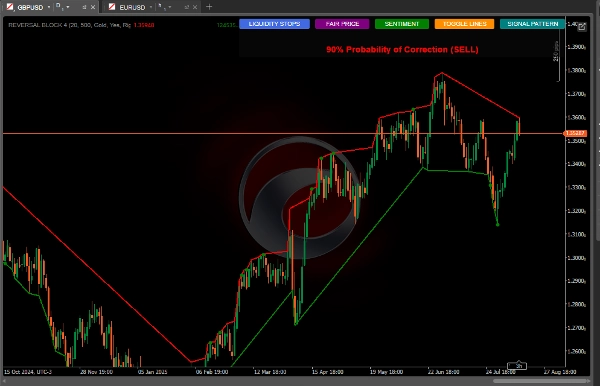
緑の点:価格が破られていない安値を上回って終値をつけたときの買いシグナル。
赤の点:価格が破られていない高値を下回って終値をつけたときの売りシグナル。
流動性プール:
水平線は流動性のあるエリア(潜在的なターゲットまたは反転ポイント)を示します。
現在の価格の上/下の流動性の関係を監視してください。
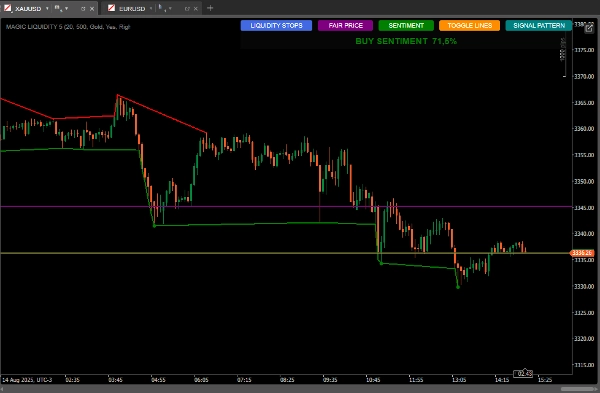
市場センチメント:
「SENTIMENT」ボタンを使って、優勢な方向と信頼度を確認してください。
高い信頼度の買いセンチメントは継続的な成長を示唆します。高信頼度の売りセンチメントは弱気の継続を示唆します。
ローソク足パターン:
「SIGNAL PATTERN」ボタンは分析し、
定量的比率に基づく修正の可能性を示します
最も取引された価格(フェアプライス):
「FAIR PRICE」ボタンは、その日の最も取引量の多い価格レベルを表示します。
価格の磁石として、またはサポート/レジスタンスとして機能することがあります。
使用戦略
保守的戦略:
オーダーブロックシグナルが優勢なセンチメントと一致するときのみ取引してください。
利確ターゲットとして流動性プールを使用してください。
積極的戦略:
多くのストップが蓄積された流動性プールに価格が近づくと反転を予測してください。
センチメントと価格アクションの乖離を利用して逆トレンド取引を行ってください。
追加の確認:
インジケーターが示すローソク足パターンと比較してください。
フェアプライスが近くにあるかどうかを確認してください。
リスク管理。
ストップロス:
買いの場合は直近のオーダーブロックの下に置いてください
売りの場合は直近のオーダーブロックの上に置いてください
テイクプロフィット:
近くの流動性プールをターゲットにしてください
ターゲット設定には上/下の流動性比率を考慮してください
高度なヒント
チャートが混雑したときは「TOGGLE LINES」ボタンで流動性ラインを無効にしてください
動きの強さを評価するために清算されたストップの数を監視してください
フェアプライスは、ダイナミックなサポート/レジスタンスのようなレンジ相場で特に有用です
確認のために他のインジケーター(ボリューム、移動平均)と組み合わせてください
インジケーターのボリューム:
https://ctrader.com/pt/products/635


