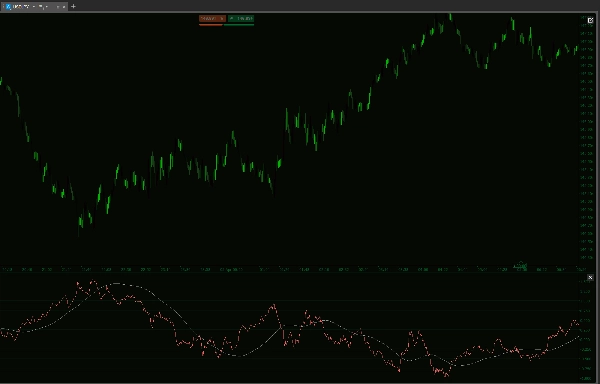
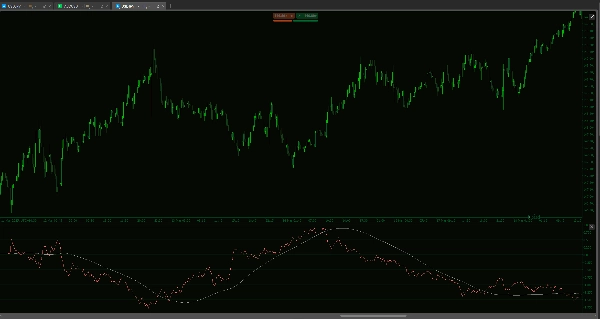
Индикатор
Indices
Forex
USDJPY
Yen Index w HMA
Логотип продукта "Yen Index w HMA"
03/09/2025
18
Desktop
С 14/01/2025
Продажи
26
Бесплатные установки
5279
Загруженное изображение продукта "Yen Index w HMA"Загруженное изображение продукта "Yen Index w HMA"

Introducing the Historical JXY Yen Index Indicator – the ultimate tool for gauging the strength of the Japanese Yen against major currencies. This advanced cTrader indicator synthesizes data from six key Yen pairs (EURJPY, GBPJPY, AUDJPY, NZDJPY, CADJPY, USDJPY) with customizable weightings to deliver a comprehensive, real-time picture of Yen performance.

Key Features:

  • Comprehensive Currency Blend:
    Integrates six pivotal Yen pairs, each weighted to reflect their market impact. The inverted percentage change mechanism ensures that as a pair strengthens against the Yen, its contribution accurately signals the Yen’s overall performance.
  • Multi-Layered Trend Analysis:
    Benefit from a suite of smoothing tools including an optional SMA and dual Hull Moving Averages (short and long term) that filter out noise and highlight true market trends, giving you the clarity to make confident trading decisions.
  • Customizable & Robust:
    Adjust parameters like the candle lookback count, weightings, and moving average periods to tailor the indicator to your unique trading style. Optional session resets keep your analysis fresh and aligned with the start of new trading sessions.
  • Actionable Insights:
    Whether you're tracking subtle shifts or major trends, the Historical JXY Indicator provides the actionable insights you need to capitalize on the momentum of the Yen.

Elevate your trading strategy with this cutting-edge technical tool. Harness the power of the Historical JXY Yen Index Indicator and turn complex market data into clear, strategic trading opportunities.


--------------------------

Please feel free to check out my other indicators!

https://ctrader.com/products/1181

https://ctrader.com/products/1182

https://ctrader.com/products/1180

https://ctrader.com/products/1015

https://ctrader.com/products/555

https://ctrader.com/products/553

https://ctrader.com/products/554

https://ctrader.com/products/552

https://ctrader.com/products/557

https://ctrader.com/products/845

https://ctrader.com/products/848

https://ctrader.com/products/847

https://ctrader.com/products/846

https://ctrader.com/products/551

https://ctrader.com/products/574

https://ctrader.com/products/573

https://ctrader.com/products/556

https://ctrader.com/products/558

https://ctrader.com/products/559

https://ctrader.com/products/560


Больше от этого автора
Market Sessions - Free
Track major trading sessions (Tokyo, London, New York) with customizable colors and visual sessions on your chart.
Supply Demand V1-Premium
Auto-detect supply & demand zones, remove broken levels, and trade smarter with real-time alerts. Precision made simple.
Supply Demand - BasicV1
Supply and demand zones. They're important. Here's a free version to get you started!
MTF Candle Window - On Chart
The Multi-Timeframe Candle Indicator displays candles from multiple timeframes in one window, enhancing market analysis!
Volume Profile Triple Line - POC Median Mode
The Advanced Volume Profile Indicator calculates POC, Median, and Mode, revealing key price levels for smarter trading.
Market Sessions V2_NSC
Market Session V2: Full Control. colors, history, session/text toggles, font size. Elevate your strategy!
MTF Candle Countdown
Stay ahead with a real-time countdown to candle closes on all key timeframes: 5m, 15m, 30m, 1H, 4H, and Daily.
Supply Demand Premium V2_NSC
The long awaited new and improved Supply Demand Premium V2 indicator. Unlock greater trading opportunities now!
Open Trade PipsV1
This indicator tracks the unrealised amount of pips in your open positions.
Commodity Channel Index Smoothed w Alerts_NSC
Smoothed CCI alerts! Audio & arrow signals for +/-100 crosses. Custom sounds & arrow filters. Precision trading!
Индикатор
Indices
Commodities
CCI - With Arrows and 40 80 EMA Logic_noSourceCode
The Advanced CCI & EMA Indicator combines the CCI with 40 & 80 EMA logic to generate precise arrows signaling direction
Open Trade ProfitV1
A simple indicator that tracks the value of your open trades in pips.
Market Session V3_NSC
Version 3: Full control of session display including start and end times of all 3 sessions!
Индикатор
Signal
USDJPY
On Balance Volume USD - Combined
See USD demand in one line—Composite OBV fuses six major FX pairs into a clear momentum gauge.
Вам также может понравиться
Популярный
$ 29
overbought oversold
Overbought Oversold Indicator
Daily Sessions HighLow Helper
Shows daily and sessions highs / lows and session boxes, everything configurable
MTF Candles
Multi Timeframe Candle drawing. Draw Any candles from any timeframe on your chart :-)
Популярный
$ 15
Индикатор
NAS100
NZDUSD
XAUUSD
+11
FBX VWAP
FBX VWAP Anchored — Professional VWAP
Pivot Point Super Trend
Laser entries with pivot confirmation. No repaint, all timeframes. Professional results.
Индикатор
NAS100
NZDUSD
XAUUSD
+13
Market Swing Structure Pullback Pro
Auto-detect support and resistance & structure, highlight pullbacks/BOS retests, and filter with candle confirmation.
Индикатор
RSI
Breakout
Supertrend
+3
Fibonacci Linear Regression Multi-timeframe
Combining Fibonacci levels and regression to analyze multidimensional market trends across multiple timeframes¡
Automatic Fibonatti
Automatically plots Fibonacci retracement levels using the highest and lowest points of a customizable time range
Высокий рейтинг
Бесплатно
FairValueGap
This Fair Value Gap (FVG) indicator is a technical analysis tool used to identify potential price imbalances.
IR CheckList
you could put your check list in your chart you could split your test with “,” you could put your checklist in indicat
Индикатор
RSI
XAUUSD
Breakout
+4
Multi-Level Candle Bias Tracker
Price direction by calculating the probability of reaching new highs/lows. Shows levels & stats📈
Pips V4Final
Displays pips from daily open with high/low. Clean, customizable, perfect for quick daily price context.
StochasticRSI
Stochastic RSI (StochRSI) is a technical indicator used to measure the strength and weakness of the RSI.
Популярный
$ 36
Индикатор
RSI
Indices
Signal
QQE-MTF
Multi-timeframe version of the Quantitative Qualitative Estimation (QQE) indicator.
[Hamster-Coder] Pivot Points (Demo)
[Hamster-Coder] Pivot Points (Demo)
Индикатор
NAS100
XAUUSD
Commodities
+10
MARKET_STRUCTURE BOS_CHoCH
MarketStructurePro – Smart BOS/CHoCH
Индикатор
Indices
RSI
Signal
Rsi + Volume
This indicator combines RSI (Relative Strength Index) with volume analysis to generate more reliable trading signals.