
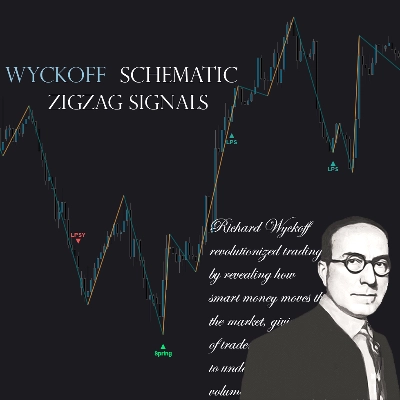
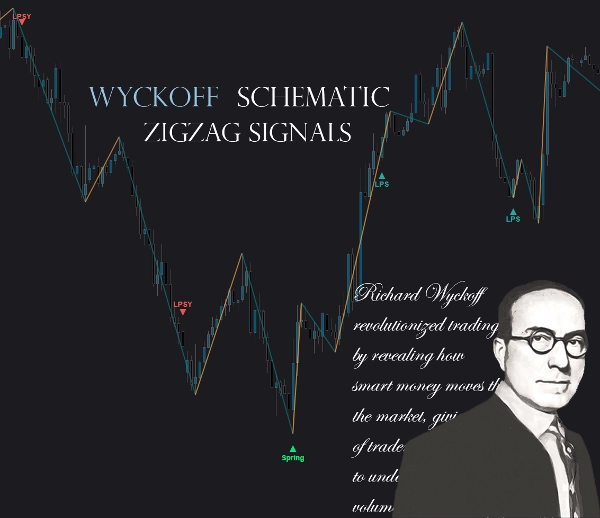
Wyckoff Schematic ZIGZAG Signals
Indicator
Version 1.0, May 2026
Windows, Mac

627.64M
Traded volume
3.73M
Pips won
24
Sales
58
Free installs
Description
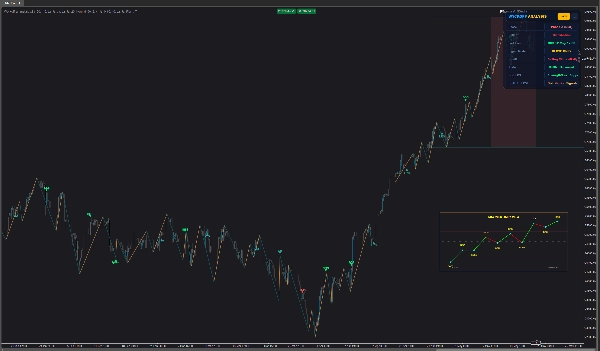
The Wyckoff Schematic Indicator
is a professional-grade market structure tool that automates the identification and visualization of Wyckoff accumulation and distribution logic. It translates raw price and volume data into a structured institutional-style market map.
Core Functionality
- Automatically detects Wyckoff market phases (A–E) for both accumulation and distribution
- Identifies key structural events such as:
- Selling Climax (SC)
- Automatic Rally (AR)
- Secondary Tests (ST)
- Springs & Upthrusts
- Signs of Strength (SOS)
- Last Points of Support (LPS)
- Buying Climax (BC)
- Upthrust After Distribution (UTAD)
- Last Point of Supply (LPSY)
Market Structure & Logic
- Uses volume spikes vs. moving average volume to detect institutional activity
- Combines:
- Price range compression/expansion
- Swing high/low structure
- Mid-range equilibrium zones
- Dynamically calculates:
- Support levels
- Resistance levels
- Mid-range market equilibrium
Visual Analysis Tools
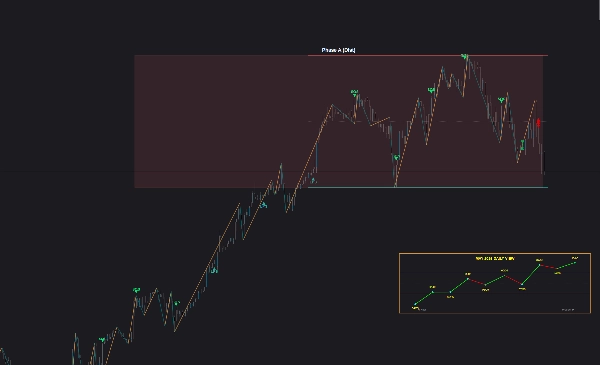
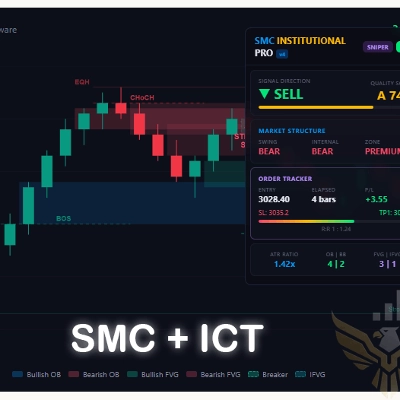
- Real-time phase boxes (A–E cycles) directly on chart
- Clear labeling of Wyckoff events with directional markers
- Built-in zigzag structure for swing clarity
- Color-coded phases for instant visual interpretation
- Optional higher-level wave overlay for broader market context
Advanced Features
- Fully automated detection engine (no manual drawing required)
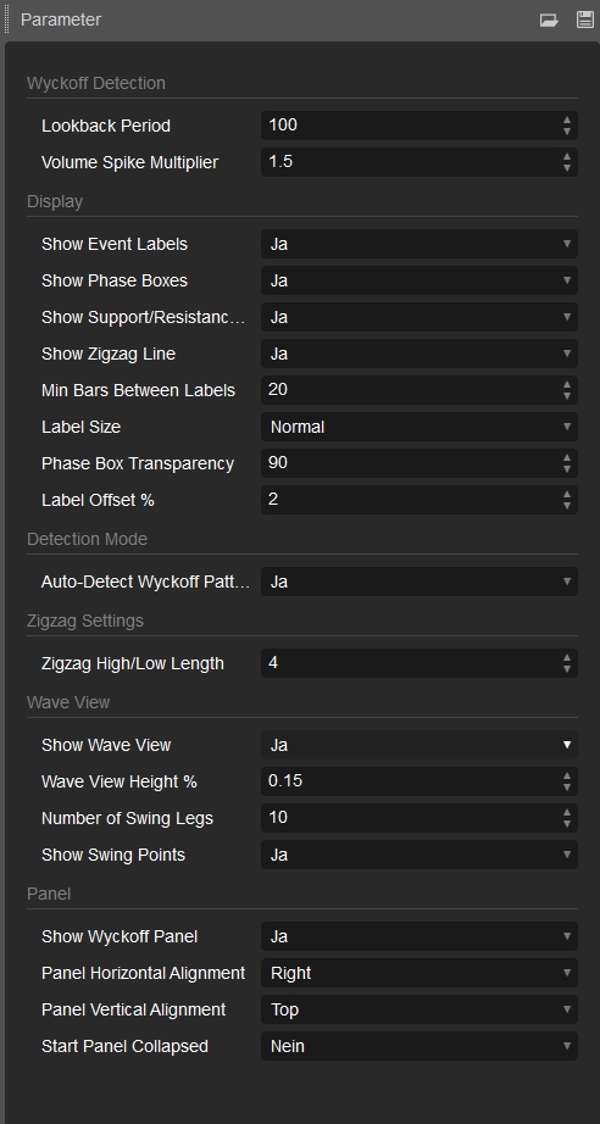
- Adaptive sensitivity based on lookback period and volume multiplier
- Filters to reduce noise and avoid over-signaling
- Minimum-bar logic to prevent cluttered labeling
- Real-time recalculation on each closed bar
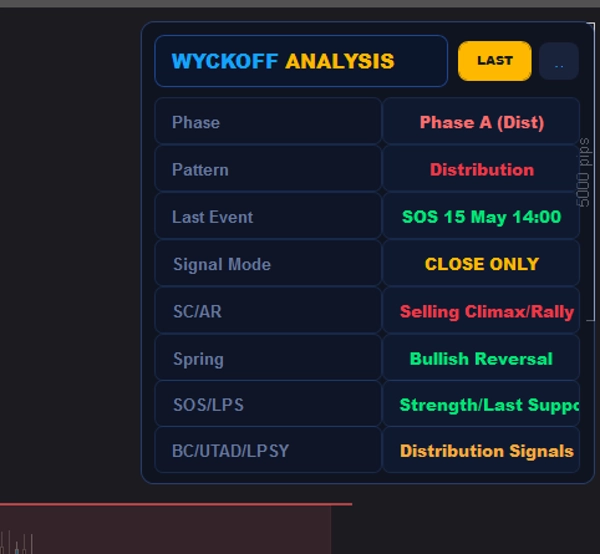
Professional Dashboard Panel
- Live Wyckoff state overview:
- Current phase (Accumulation / Distribution)
- Detected pattern (Spring, SOS, LPS, etc.)
- Last market event with timestamp
- Signal mode display (close-based logic)
- Color-coded status badge for quick interpretation
- Collapsible UI panel for clean chart experience
Target Use Case
This indicator is designed for traders who focus on:
- Smart Money Concepts (SMC)
- Wyckoff methodology
- Volume-price analysis
- Institutional order flow interpretation
It provides a structured, rule-based interpretation of market behavior, removing subjective chart reading and replacing it with systematic phase detection.
Summary
Indicator profile
Indicator category
Pattern
Output type
Visualisation
Signals
Data requirements
Bars only
Volume
Supported signals
Reversal
Breakout
Level touch
Level break
Discussion
Customer reviews
0.0
Reviews: 0
Customer reviews
No reviews for this product yet. Already tried it? Be the first to tell others!
FAQ
Premium/Discount
Supertrend
Volume
Market Structure
Supply & Demand
Support & Resistance
Products available through cTrader Store, including trading bots, indicators and plugins, are provided by third-party developers and made available for informational and technical access purposes only. cTrader Store is not a broker and does not provide investment advice, personal recommendations or any guarantee of future performance.














Price
627.64M
Traded volume
3.73M
Pips won
24
Sales
58
Free installs