


คำอธิบาย
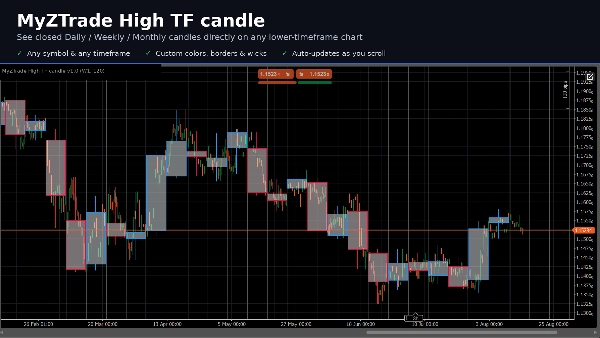
MyZTrade High TF candle เป็นเครื่องมือแสดงผลหลายกรอบเวลาที่ซ้อนแท่งเทียนกรอบเวลาที่สูงกว่า (รายวัน รายสัปดาห์ หรือรายเดือน — เลือกได้) โดยตรงบนกราฟปัจจุบันของคุณในรูปแบบกล่องสีที่มีตัวแท่งเทียน ขอบ และไส้เทียนสูง/ต่ำ คล้ายกับการดูแท่งเทียน D1 หรือ W1 โดยไม่ต้องสลับกราฟ
จะวาดเฉพาะแท่งเทียนกรอบเวลาที่สูงกว่าที่ปิดแล้วเท่านั้น แท่งเทียนที่ยังสร้างอยู่จะถูกข้ามโดยเจตนา ดังนั้นกล่องจะไม่เปลี่ยนรูปร่างในขณะที่ช่วงเวลานั้นยังเปิดอยู่ — จะปรากฏขึ้นเมื่อช่วงเวลานั้นปิดสมบูรณ์แล้วเท่านั้น
ประเภทอินดิเคเตอร์: ซ้อนหลายกรอบเวลา / เครื่องมือบริบทการเคลื่อนไหวราคา ใช้งานได้กับสัญลักษณ์ใดก็ได้และกรอบเวลาที่ต่ำกว่าใดก็ได้ (เช่น M15, H1, H4)
คุณสมบัติหลัก:
- เลือกกรอบเวลาที่สูงกว่าได้: รายวัน รายสัปดาห์ หรือรายเดือน
- จำนวนกล่องที่มองเห็นได้สามารถตั้งค่าได้ เพื่อให้การโหลดกราฟยังคงควบคุมได้ในประวัติศาสตร์ที่ยาวนาน
- สีเติมและสีขอบแยกต่างหากสำหรับแท่งเทียนขาขึ้นและขาลง
- ไส้เทียนสูง/ต่ำเป็นตัวเลือกบนแต่ละกล่อง
- วาดใหม่โดยอัตโนมัติเมื่อคุณเลื่อนกราฟ
กรณีการใช้งานในการเทรด: อ่านโซนแนวรับ/แนวต้านกรอบเวลาที่สูงกว่าและแนวโน้มรายวันหรือรายสัปดาห์ในขณะที่ดำเนินการบนกรอบเวลาที่ต่ำกว่า และศึกษาว่าราคาทำงานอย่างไรภายในช่วงกรอบเวลาที่สูงกว่าที่เสร็จสมบูรณ์โดยไม่ต้องสลับกราฟไปมา
สรุป
รีวิวจากลูกค้า
การสนทนา
คำถามที่พบบ่อย
เพิ่มเติมจากผู้เขียนคนนี้



















!["[Hamster-Coder] Moving Average MTF" โลโก้](https://cdn.ctrader.com/image/webp/b11b98b1-194d-4b8e-b00e-d611826ad159_31226)

ราคา