説明
🧠 OBScope™ – 高確率トレードのための精密オーダーブロックマッピング
OBScope™は、スイングハイ、スイングロー、および高度なプライスアクション分析に基づいて高確率のオーダーブロックゾーンを検出・可視化する最先端のインジケーターで、市場の隠れた構造を解き明かします。
経験豊富なトレーダーであれ、エッジを磨いている途中であれ、OBScope™はスマートマネーが足跡を残す機関投資家の痕跡をクリアに示します。
🔍 主な特徴:
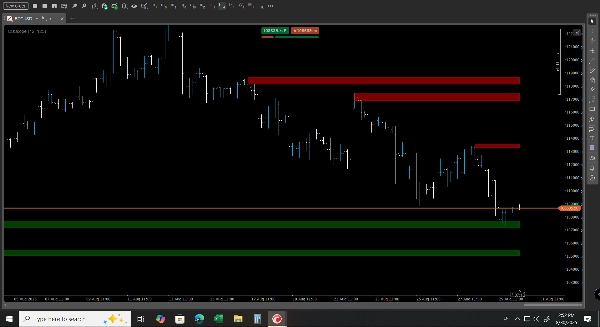
• 動的オーダーブロック検出
スイング構造とボリューム情報に基づくロジックを用いて、価格が過去に反転または統合したゾーンを自動的に特定し表示します。
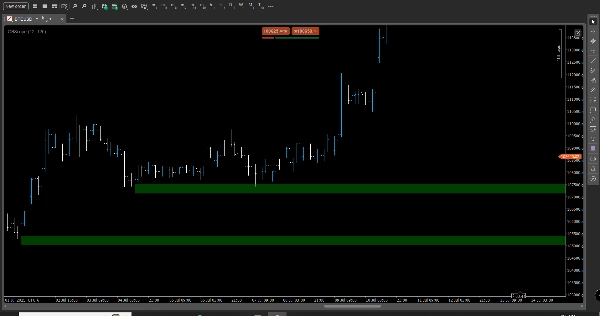
• 高確率トレードゾーン
ノイズを除去し、反応履歴が証明され、最適なリスク・リワード設定を持つ統計的に最も重要なオーダーブロックのみを強調表示します。
• スイングベースのロジック
スイングハイ/ロー分析を統合し、市場構造の意味あるゾーンにアンカーを置き、タイミングと方向性のバイアスを改善します。
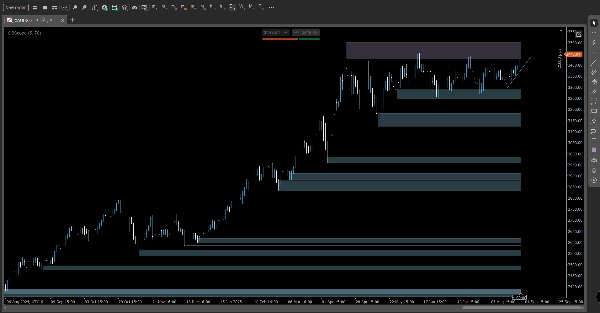
• パフォーマンス重視の設計
実際の市場で検証されたテスト済みアルゴリズムに基づき、OBScope™は複数の資産クラスと時間軸で一貫した結果を示しています。
• カスタマイズ可能な可視化
調整可能なゾーンの不透明度、カラ―コーディングを備えたクリーンでモジュラーなUIは、裁量取引およびアルゴリズム取引のワークフローに合わせて調整可能です。
📈 トレーダーがOBScope™を愛用する理由:
• ゾーン識別の推測を減らす
• 他の戦略(例:流動性スイープ、不均衡の埋め)とのコンフルエンスを強化
• ブレイクアウトおよびリバーサルの両方のセットアップをサポート
• スキャルピング、スイングトレード、プロップファームのチャレンジに最適
概要
カスタマーレビュー
5 | 100 % | |
4 | 0 % | |
3 | 0 % | |
2 | 0 % | |
1 | 0 % |


