Açıklama
3-Bar Tersine Dönüş
📊 BU NEDİR?
3-Bar Tersine Dönüş, tam olarak üç ardışık mum tarafından oluşturulan belirli dönüş desenlerini tanımlayan teknik bir göstergedir. Bu klasik desen, fiyat yönündeki potansiyel değişiklikleri net bir görsel yapı ile sinyaller: bir trend mumu, bir tükenme mumu ve bir dönüş mumu.
🎯 NE İÇİN KULLANILIR?
Bu gösterge, yatırımcılara şunlarda yardımcı olur:
- 3-mum yapısı ile yükseliş ve düşüş dönüşlerini tespit etmek
- Yanlış sinyalleri filtrelemek, yapılandırılabilir trend onayı ile
- Onaylanmış desenlere dayanarak destek ve direnç bölgelerini belirlemek
- Sezgisel grafik işaretçileri ile işlem fırsatlarını görselleştirmek
- Her zaman diliminde yüksek olasılıklı dönüşlerde işlem yapmak
🔍 NASIL ÇALIŞIR?
Yükseliş Deseni (3-Bar Yükseliş Tersine Dönüşü)
Üç mum yapısı:
- Mum 1 (Düşüş): Açılışın altında kapanış - satış baskısını doğrular
- Mum 2 (Tükenme düşüşü): Mum 1'in altında yeni dipler VE yeni zirveler yapar, düşüşle kapanış - teslim olma sinyali ⚠️
- Mum 3 (Yükseliş dönüşü): Açılışın üzerinde ve mum 1'in zirvesinin üzerinde kapanış - kontrol değişimini doğrular ✅
Düşüş Deseni (3-Bar Düşüş Tersine Dönüşü)
Ters yapı:
- Mum 1 (Yükseliş): Açılışın üzerinde kapanış - alış baskısını doğrular
- Mum 2 (Uzama yükselişi): Mum 1'in üzerinde yeni zirveler VE yeni dipler yapar, yükselişle kapanış - aşırı uzama sinyali ⚠️
- Mum 3 (Düşüş dönüşü): Açılışın altında ve mum 1'in dibinin altında kapanış - kontrol değişimini doğrular ✅
Görsel Yönetim Sistemi (Durum Makinesi)
Gösterge, her deseni üç ardışık aşamada işler:
1. AŞAMA - DESEN TESPİTİ: 🔍
- Tam 3-mum yapısı tanımlanır
- Bir üçgen göstergesi (▲ yükseliş / ▼ düşüş) üçüncü mumda görünür
- Bir yarı saydam kurulum dikdörtgeni çizilir ve şunları kapsar:
-
- Yükseliş: Mum 1'in zirvesinden en düşük dibe (mum 2 veya 3) kadar
- Düşüş: Mum 1'in dibinden en yüksek zirveye (mum 2 veya 3) kadar
- Bu dikdörtgen, dönüşün gerçekleştiği "savaş alanını" işaretler
2. AŞAMA - ONAY VEYA GEÇERSİZLİK: ⏳
Sistem, deseni doğrulamak için sonraki mumu bekler:
Yükseliş Onayı: ✅
- Sonraki mumun kapanışı, mum 1'in zirvesini (dikdörtgen tavanı) aşmalıdır
- Bir dolgun nokta (●) onay işareti olarak görünür
- Dikdörtgen aktif bir destek bölgesi olur
Düşüş Onayı: ✅
- Sonraki mumun kapanışı, mum 1'in dibini (dikdörtgen tabanı) kırmalıdır
- Bir dolgun nokta (●) onay işareti olarak görünür
- Dikdörtgen aktif bir direnç bölgesi olur
Geçersizlik: ❌
- Yükseliş başarısız olur eğer: kapanış dikdörtgenin minimumunun altında veya düşüş deseni görünürse
- Düşüş başarısız olur eğer: kapanış dikdörtgenin maksimumunun üstünde veya yükseliş deseni görünürse
- Dikdörtgen genişlemesi durur (desen ölür)
Bekleme Uzatması: ⏸️
- Onay veya başarısızlık yoksa, dikdörtgen mum mum yatay olarak uzar
3. AŞAMA - AKTİF DESTEK/DİRENÇ BÖLGESİ: 🎯
- Onaylandıktan sonra, bölge sağa doğru sonsuza kadar genişler
- Yükseliş bölgesi: Fiyat tabanın üzerinde kaldığı sürece aktif kalır
- Düşüş bölgesi: Fiyat tavanın altında kaldığı sürece aktif kalır
- Bölge, fiyat tamamen ters yönde kırdığında devre dışı kalır
⚙️ ANA YAPILANDIRMA
Desen Modu
Hangi desen varyasyonlarının kabul edileceğini kontrol eder:
- Normal: Sadece mum 3, mum 1'in aralığı içinde kapandığında kabul eder
-
- Yükseliş: Kapanış < mum 1'in zirvesi (ılımlı dönüş)
- Düşüş: Kapanış > mum 1'in dibi (ılımlı dönüş)
- Gelişmiş: Sadece mum 3, mum 1'in aralığı dışında kapandığında kabul eder 🔥
-
- Yükseliş: Kapanış > mum 1'in zirvesi (patlayıcı dönüş)
- Düşüş: Kapanış < mum 1'in dibi (patlayıcı dönüş)
- Tümü (Önerilen): Her iki türü ayırt etmeksizin kabul eder ⭐
Destek/Direnç Türü
- Seviye: Temel çizgi işlevselliği (bu sürümde sınırlı)
- Bölge: Onay sonrası SR bölgelerini işaretleyen gölgeli dikdörtgenler çizer 📦
- Yok: SR bölgeleri yok, sadece tespit edilen desenleri gösterir
Özelleştirilebilir Renkler 🎨
- Yükseliş Dönüş Rengi: Üçgenler, dikdörtgenler ve yükseliş bölgeleri için (varsayılan:
#2962FF- mavi) - Düşüş Dönüş Rengi: Üçgenler, dikdörtgenler ve düşüş bölgeleri için (varsayılan:
#FF9800- turuncu) - Yükseliş Trend Rengi: Trend filtre görselleştirmesi için (varsayılan:
#089981- yeşil) - Düşüş Trend Rengi: Trend filtre görselleştirmesi için (varsayılan:
#F23645- kırmızı)
🔧 TREND FİLTRELERİ
Gösterge, genel trend yönüne göre desenleri dört yöntemle filtreleyebilir:
1. Hareketli Ortalama Bulutu ☁️
Trend belirlemek için iki hareketli ortalama kullanır:
Parametreler:
- Hareketli Ortalama Türü: Basit, Üssel, Hull, Ağırlıklı vb. (varsayılan: Hull)
- Hızlı Periyot: 50 (varsayılan)
- Yavaş Periyot: 200 (varsayılan)
Filtre Mantığı (Hizalanmış):
- Yükseliş trendi tespit edilir: Fiyat > Hızlı MA VE Hızlı MA > Yavaş MA ✅
- Düşüş trendi tespit edilir: Fiyat < Hızlı MA VE Hızlı MA < Yavaş MA ✅
- Sadece yükseliş trendinde yükseliş desenleri ve düşüş trendinde düşüş desenleri gösterilir
Ters Mantık (Ters):
- Büyük karşı trend dönüşlerini yakalamak için koşulları tersine çevirir
2. Supertrend 📈
Volatiliteye dayalı trend takip göstergesi (ATR):
Parametreler:
- ATR Periyodu: 10 (varsayılan) - volatilite hesaplama penceresi
- Çarpan Faktörü: 3.0 (varsayılan) - gösterge hassasiyeti
Mantık:
- ATR kullanarak üst ve alt bantları hesaplar
- Fiyat Supertrend'in üzerinde = yükseliş trendi 🟢
- Fiyat Supertrend'in altında = düşüş trendi 🔴
- Desenleri yapılandırılmış hizalamaya göre filtreler
3. Donchian Kanalları 📊
Belirli bir dönem boyunca fiyat uç noktalarını kullanır:
Parametreler:
- Kanal Uzunluğu: 13 (varsayılan)
Mantık:
- Üst kanal = N periyotun en yüksek zirvesi
- Alt kanal = N periyotun en düşük dibi
- Orta nokta = (üst + alt) / 2
- Fiyat orta noktanın üzerinde = yükseliş trendi 🟢
- Fiyat orta noktanın altında = düşüş trendi 🔴
4. Yok (Filtre Yok) 🔓
Genel trendi dikkate almadan tüm tespit edilen 3-bar desenlerini gösterir. Şunlar için faydalıdır:
- Aralıkta sıkışmış piyasalar
- Saf desen analizi
- Herhangi bir bağlamda dönüş işlemleri
Trend Hizalaması
Filtre aktif olduğunda uygulanır:
- Hizalanmış: Sadece tespit edilen trendle UYUMLU desenleri gösterir ➡️
-
- Yükseliş desenleri sadece yükseliş trendinde
- Düşüş desenleri sadece düşüş trendinde
- Ters: Sadece tespit edilen trende KARŞI desenleri gösterir 🔄
-
- Düşüş trendinde yükseliş desenleri (büyük dönüş)
- Yükseliş trendinde düşüş desenleri (büyük dönüş)
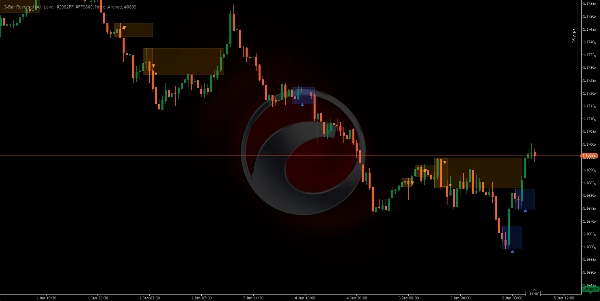
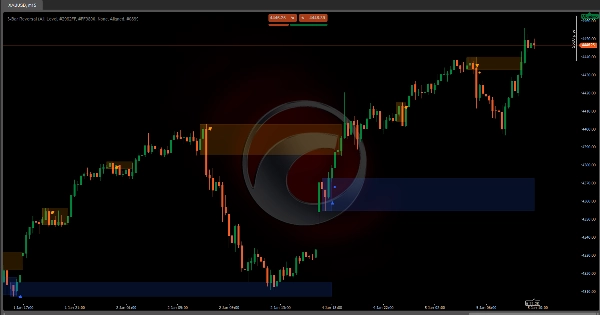
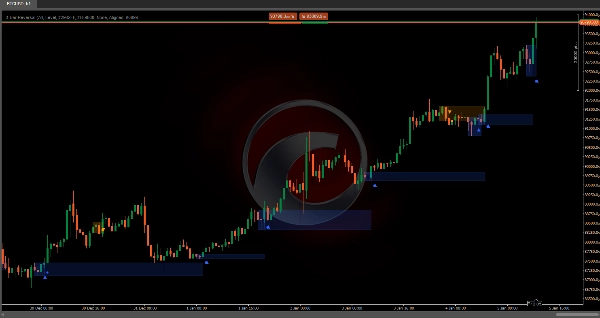
Özet
It operates in three phases: pattern detection, confirmation or invalidation based on the next candle's behavior, and establishing active support or resistance zones that extend while price respects them. The indicator supports configurable pattern modes (Normal, Enhanced, or All) to control acceptance criteria for reversals.
Trend filtering is available through four methods—Moving Average Cloud, Supertrend, Donchian Channels, or no filter—allowing users to align pattern signals with overall market trends or capture counter-trend reversals. Confirmed reversal zones are displayed as shaded rectangles or levels, customizable in color for bullish and bearish signals, trend filters, and zones.
This tool is designed for use on any timeframe and across various markets, including forex pairs (EURUSD, GBPUSD, USDJPY, NZDUSD), commodities (XAUUSD), indices (NAS100), and cryptocurrencies (BTCUSD). It aids traders in detecting high-probability reversals, filtering false signals, and identifying support and resistance zones with clear visual markers.


!["[Stellar Strategies] Inside Bar with Signals" logosu](https://cdn.ctrader.com/image/webp/1d9e8bfa-3b2c-4440-bb37-5856902008a7_30683)