
Deskripsi
https://chartshots.spotware.com/c/695bec6c74055
https://chartshots.spotware.com/c/695bed35bf7b7
https://chartshots.spotware.com/c/695bed6b139df
https://chartshots.spotware.com/c/695bed8ea6bdb
📊 PIVOT BREAKER BLOCK
🤔
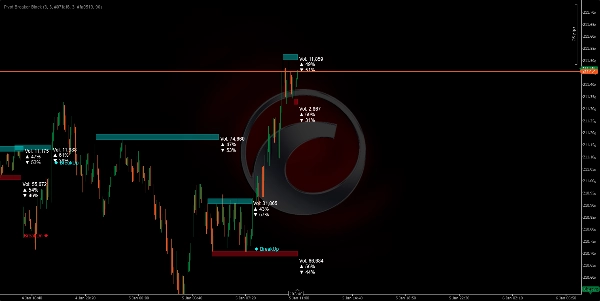
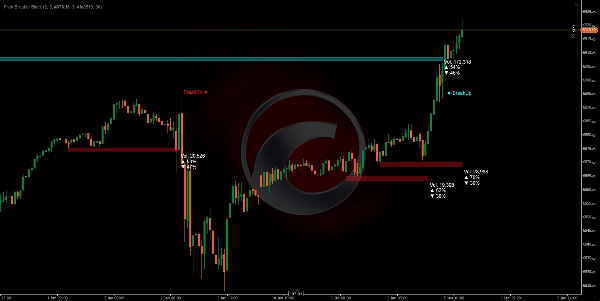
Pivot Breaker Block adalah indikator visual yang secara otomatis mengidentifikasi titik balik harga utama (puncak dan lembah lokal) dan membangun "blok harga" di sekitar level kritis ini. Ketika harga mendekati level serupa lagi, algoritma menggambar persegi panjang (zona) yang mewakili resistensi (Pasokan) dan dukungan (Permintaan) area.
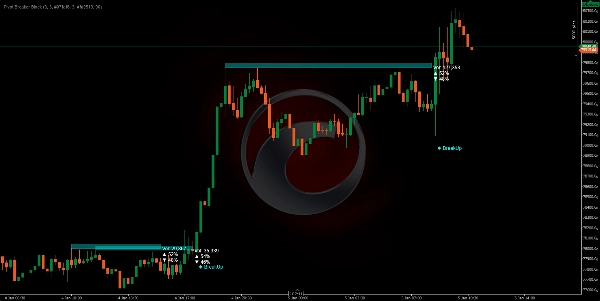
Sistem terus memantau apakah harga menembus zona-zona ini, menghasilkan sinyal visual yang jelas: BreakUp (breakout bullish) 🔼 atau BreakDn (breakout bearish) 🔽.
UNTUK APA INI? 🎯
1. Mengidentifikasi Zona Kontrol Pasar 🗺️
Algoritma mendeteksi di mana harga menunjukkan resistensi kuat (langit-langit penjualan) atau dukungan (lantai pembelian). Ketika level ini muncul beberapa kali, pasar mengonfirmasi pentingnya.
2. Memvisualisasikan Akumulasi dan Distribusi Volume ⚖️
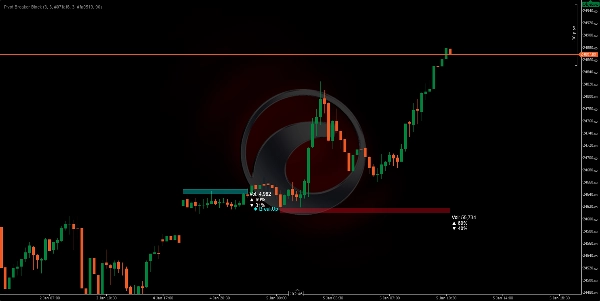
Setiap blok menunjukkan:
- Total volume yang diproses di zona tersebut
- % pembelian (lilin bullish) 📈
- % penjualan (lilin bearish) 📉
Ini memungkinkan Anda melihat apakah pasar membeli atau menjual di dalam area tersebut, mengungkapkan niat pasar.
3. Mengantisipasi Titik Breakout 🚨
Ketika harga mendekati zona-zona ini, Anda memiliki probabilitas tertinggi terjadinya pergerakan signifikan. Algoritma secara otomatis mendeteksi saat harga menembusnya, memberi peringatan secara waktu nyata.
BAGAIMANA LOGIKA BEKERJA ⚙️
Fase 1: Deteksi Pivot (Titik Balik) 🔍
Algoritma mencari puncak dan lembah yang memenuhi kriteria tertentu:
- Pivot High: Sebuah lilin yang puncaknya lebih tinggi daripada 5 lilin sebelumnya DAN 5 lilin berikutnya.
- Pivot Low: Sebuah lilin yang lembahnya lebih rendah daripada 5 lilin sebelumnya DAN 5 lilin berikutnya.
Parameter "5" ini (Pivot Lookback) dapat disesuaikan berdasarkan volatilitas yang ingin Anda tangkap.
Fase 2: Pengakuan Zona Kontrol 🎯
Setelah pivot teridentifikasi, sistem membandingkannya dengan pivot sebelumnya dari tipe yang sama. Jika perbedaan antara keduanya kurang dari 20% ATR (ukuran volatilitas saat ini), itu berarti pasar mengunjungi kembali level serupa yang sebelumnya ditolak.
Fase 3: Pengukuran Zona 📏
Tinggi setiap blok dihitung secara dinamis menggunakan ATR (Average True Range):
- Pasokan (Merah): Langit-langit adalah ATR × 0.5 poin di atas pivot.
- Permintaan (Sian): Lantai adalah ATR × 0.5 poin di bawah pivot.
Ini berarti zona-zona secara otomatis menyesuaikan dengan volatilitas aset. Di pasar yang volatil, zona lebih lebar; di pasar yang tenang, zona lebih sempit.
Fase 4: Analisis Volume Waktu Nyata 💹
Saat harga berada di dalam zona, algoritma menjumlahkan semua volume beli dan jual sejak blok dimulai:
- Beli: Semua lilin di mana penutupan lebih besar dari pembukaan (volume bullish).
- Jual: Semua lilin di mana penutupan lebih kecil dari pembukaan (volume bearish).
Persentase ini menunjukkan niat dominan di dalam zona tersebut.
Fase 5: Deteksi Breakout 🚀
Algoritma memantau setiap lilin baru:
- BreakUp (↑): Penutupan menembus di atas langit-langit Pasokan → Sinyal breakout bullish.
- BreakDn (↓): Penutupan jatuh di bawah lantai Permintaan → Sinyal breakout bearish.
Saat ini terjadi, blok dinonaktifkan dan sinyal teks muncul di layar.
CARA MENGGUNAKANNYA 🛠️
Instalasi dan Konfigurasi ⚙️
- Tambahkan indikator ke platform cTrader Anda.
- Akses parameter yang dapat disesuaikan:
ParameterMaknaRekomendasi
Pivot Lookback
Berapa banyak lilin kiri/kanan yang dievaluasi untuk mengonfirmasi pivot
5 (standar), tingkatkan pada TF yang lebih tinggi
Faktor Zona Pasokan
Tinggi blok merah (Resistensi)
5.0 (standar), sesuaikan sesuai preferensi
Faktor Zona Permintaan
Tinggi blok sian (Dukungan)
5.0 (standar), sesuaikan sesuai preferensi
Transparansi
Opasitas blok (0=tidak terlihat, 255=padat)
90 (direkomendasikan untuk visibilitas)
Warna
Sesuaikan tampilan visual
Merah untuk Pasokan, Sian untuk Permintaan
Strategi Trading 💡
Skenario 1: Entri Long (Beli) 📈
- Tunggu harga membentuk blok Permintaan (sian) dengan % pembelian > 55%.
- Saat melihat BreakUp, konfirmasi entri bullish Anda.
- Stop Loss (SL) di bawah lantai blok.
Skenario 2: Entri Short (Jual) 📉
- Cari blok Pasokan (merah) dengan % penjualan > 55%.
- Pada BreakDn, buka posisi bearish.
- Stop Loss (SL) di atas langit-langit blok.
Skenario 3: Reversal (Mean Reversion) 🔄
- Jika harga berada di dalam blok Permintaan tetapi % pembelian rendah (< 45%)...
- Antisipasi harga akan memantul naik tanpa mencapai BreakUp.
- Masuklah beli dekat lantai dengan Take Profit (TP) di langit-langit.
Kerangka Waktu Optimal ⏰
- H4/D1: Blok yang lebih signifikan, pergerakan berdurasi lebih lama.
- H1: Keseimbangan yang baik antara noise dan peluang.
- M15: Entri cepat, memerlukan konfirmasi volume.
Ringkasan
The indicator continuously monitors price action relative to these zones, providing real-time breakout signals: "BreakUp" for bullish breakouts above resistance and "BreakDn" for bearish breakouts below support. Each block displays cumulative volume data, including total volume processed and the percentage of buying (bullish) versus selling (bearish) activity, helping traders assess market intention within these areas.
Pivot Breaker Block supports multiple trading strategies, including breakout entries and mean reversion, with configurable parameters such as pivot lookback period, zone height factors, and visual transparency. It is suitable for various markets including Forex, indices, commodities, stocks, and cryptocurrencies, and works effectively on timeframes from 15 minutes to daily charts.
Key features:
- Automatic pivot detection with adjustable lookback
- Dynamic supply and demand zone sizing based on ATR
- Real-time volume accumulation and buy/sell ratio visualization
- Breakout alerts with on-screen signals
- Supports multiple asset classes and timeframes for versatile use


![Logo "Gaussian Channel [Iridio Capital]"](https://cdn.ctrader.com/image/webp/7c039209-5573-4a54-a072-f9528b503103_41960)


