present
سجل واحصل على خصم 50 دولارًا على مشترياتك الأولى
Trading product for OHLC ByFocusEdgers مؤشر Key Levels, image 1
OHLC ByFocusEdgers
مؤشر
الإصدار 1.0، May 2026
Windows, Mac
Trading product for OHLC ByFocusEdgers مؤشر Key Levels, image 2
Trading product for OHLC ByFocusEdgers مؤشر Key Levels, image 3
Trading product for OHLC ByFocusEdgers مؤشر Key Levels, image 4
Trading product for OHLC ByFocusEdgers مؤشر Key Levels, image 5
Trading product for OHLC ByFocusEdgers مؤشر Key Levels, image 6
7.56M
حجم التداول
22.21K
الربح بالبيب
271
التثبيتات المجانية

الوصف

📊 MultiTimeframe OHLC Indicator

Take your market analysis to the next level with the MultiTimeframe OHLC Indicator for cTrader 🚀

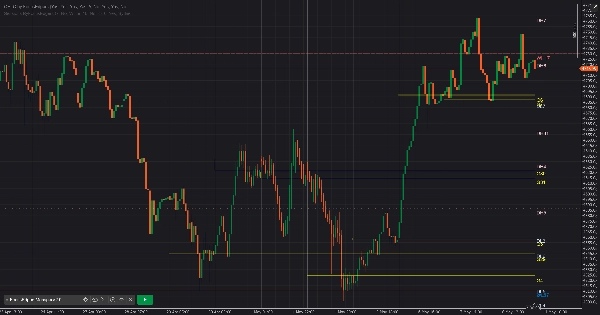
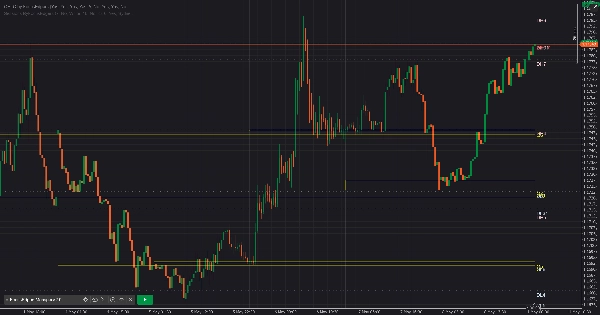
This powerful multi-timeframe tool displays key OHLC levels — Open, High, Low, Close — from multiple higher timeframes directly on your chart, helping traders identify critical price zones with clarity and precision. 🎯

✨ Features

🔹 Display OHLC levels from:

  • Daily 📅
  • Weekly 📈
  • Monthly 🌙

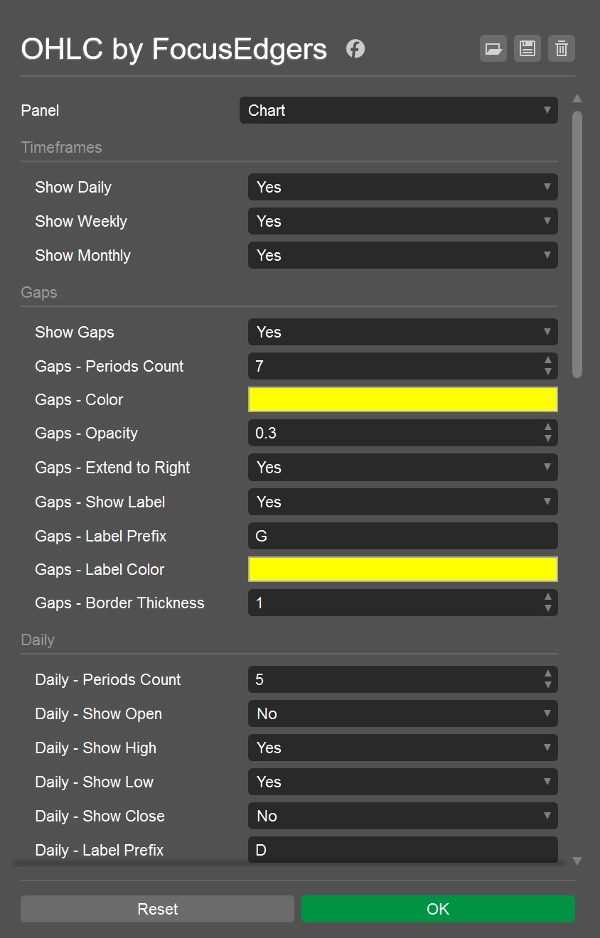
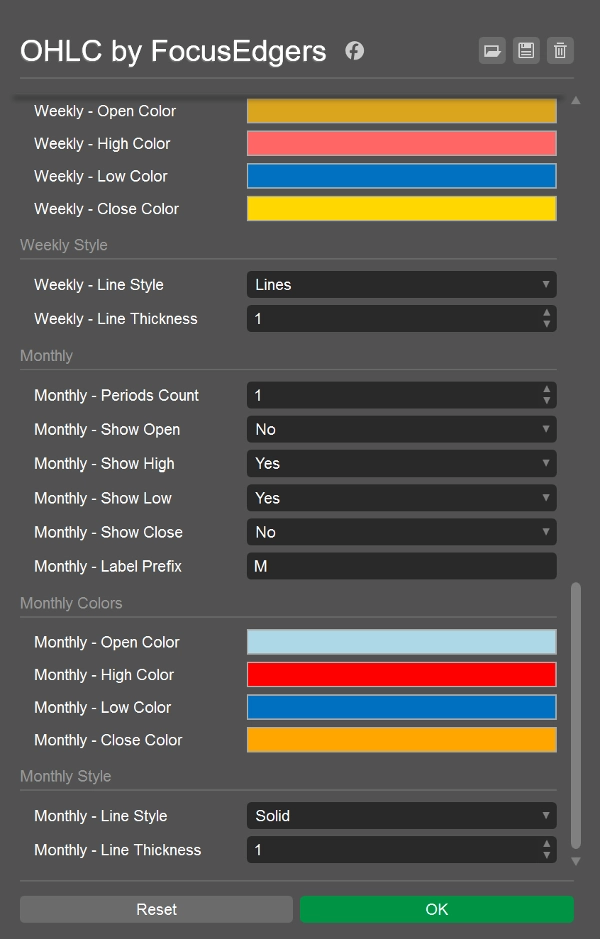
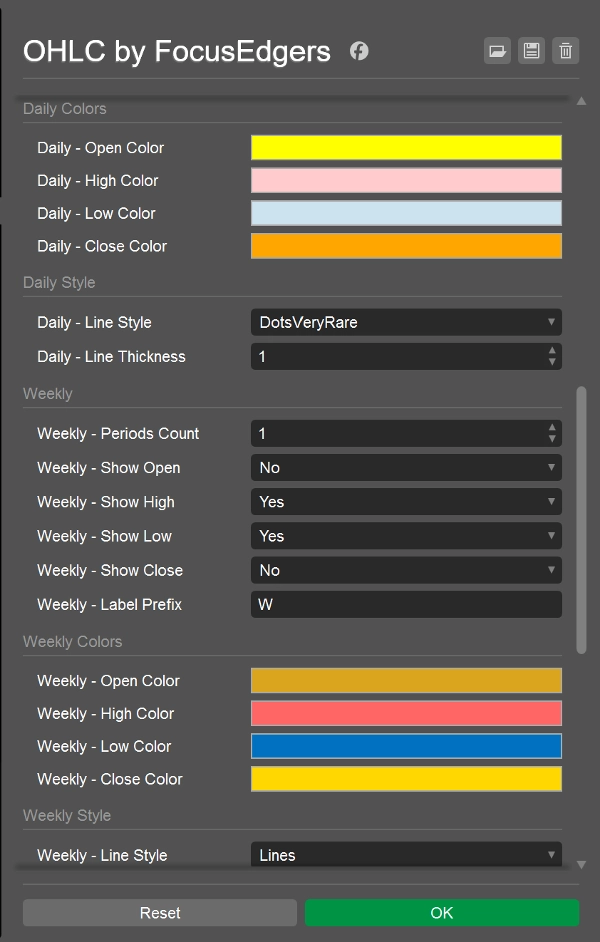
🔹 Fully customizable:

  • Enable or disable each timeframe individually
  • Show or hide Open / High / Low / Close levels independently
  • Customize colors 🎨, line styles, thickness, and labels

🔹 Smart Gap Detection ⚡

  • Automatically detects and highlights market gaps
  • Adjustable opacity and border settings
  • Optional labels for quick identification

🔹 Clean & Organized Visualization 🧠

  • Clearly labeled levels for better chart readability
  • Helps identify:
    • Key support & resistance zones
    • Liquidity areas
    • Potential breakout setups 💥
    • Institutional price levels

🔹 Optimized for Multi-Timeframe Analysis 📊
Perfect for scalpers, intraday traders, swing traders, and anyone using higher timeframe confluence in their strategy.

💡 Why Use This Indicator?

Markets often react around previous OHLC levels from higher timeframes. By visualizing these levels directly on your chart, you gain a deeper understanding of:

  • Market structure
  • Price reactions
  • Momentum shifts
  • Gap behavior
  • Breakout and reversal opportunities

Whether you're trading Forex 💱, Indices 📉, Commodities 🪙, or Crypto 🪙, this indicator gives you an edge by keeping important levels visible at all times.

⚠️ Beta Version Notice

Please note that this indicator is currently in beta 🛠️ and is still under active development.
New features, optimizations, and improvements are continuously being added to enhance performance and usability.

Your feedback is highly appreciated ❤️

Happy Trading! 🚀
الملخص

ملف تعريف المؤشر

مناقشة

تقييمات العملاء

0.0
التقييمات: 0
تقييمات العملاء
لا توجد تقييمات لهذا المنتج حتى الآن. هل جرَّبته بالفعل؟ كن أول من يخبر الآخرين!

الأسئلة الشائعة

Key Levels
يتم توفير المنتجات المتاحة من خلال cTrader Store، بما في ذلك روبوتات التداول والمؤشرات والإضافات، من قبل مطوري الطرف الثالث وإتاحتها لأغراض الوصول المعلوماتي والفني فقط. cTrader Store ليس وسيطًا ولا يقدم نصائح استثمارية أو توصيات شخصية أو أي ضمان للأداء المستقبلي.

المزيد من هذا المؤلف

مؤشر
Prop
Forex
+4
Visualize the four major trading sessions with color-coded rectangles showing session high/low ranges.

قد يعجبك أيضًا

مؤشر
📊 Smart Floating Risk Pro – Advanced Risk Management for cTrader
مؤشر
Forex
Crypto
+5
The best filter for trading trend continuations on Renko charts.
مؤشر
Prop
Forex
+4
TSPivotSMC-V2: The Fusion of Classical Pivots & Institutional Liquidity.
مؤشر
Forex
EURUSD
+4
A precision overlay tool that combines session-aware VWAP logic and standard deviations.
مؤشر
AI
Grid
+7
Follow The Trend cBot - INDICATOR - displays two Moving Average Bands for cBot or for your own use
مؤشر
VWAP
Support & Resistance
Trading.FC$_vwap Algo shows VWAP trends, dynamic support/resistance and deviation bands to spot potential trade entries.
مؤشر
ATR
SMC
+5
Candles Volume Delta is a powerful, visually intuitive indicator that transforms raw tick volume into actionable trading
مؤشر
Forex
BTCUSD
+11
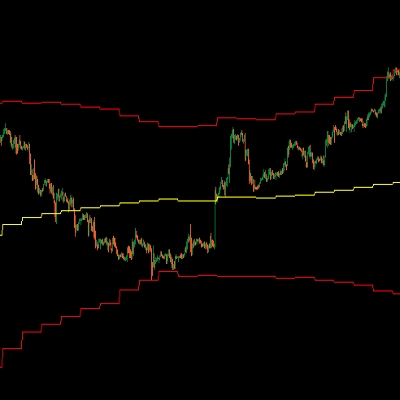
High-Low and Pivot Point
مؤشر
SMC
Prop
+15
Automatic Elliott Wave Detection with Professional Filters
مؤشر
Plot higher-timeframe Bollinger Bands for clearer structure, pullback zones, and breakout signals—without switching char
مؤشر
Volume
Key Levels
Free broker tick-volume profile context indicator with estimated POC, VAH/VAL, session/lookback modes, and clean visual
شعار "crossover 1"
الأعلى تقييمًا
4.2
(5)
$19
/
$29
مؤشر
AI
Grid
+10
Crossover Buy and Sell Alerts and signals
شعار "ORB v1.1"
مشهور
4.0
(4)
$25
مؤشر
Breakout
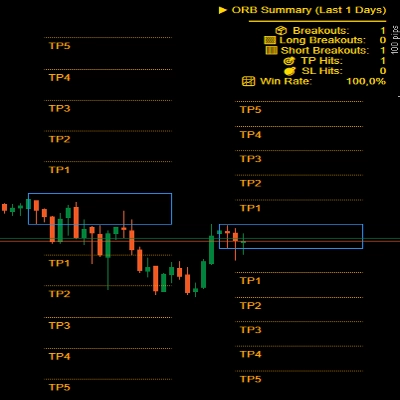
Opening Range Breakout v1.1 - Visuals + Stats
شعار "ADT_bigCandles"
الأعلى تقييمًا
4.7
(4)
$20
/
$40
مؤشر
ATR
Prop
Outside Candle Detector: Highlights major candles/zones with ATR filter & pattern labels. By Avydel Talbo, prop trader.
مؤشر
Doji
Engulfing
+1
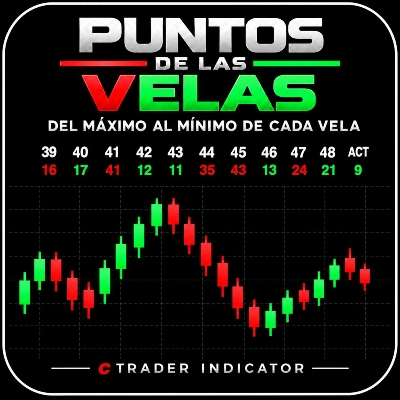
Mide en puntos la distancia entre el Máximo y el Mínimo alcanzados por cada vela, incluida la vela actual.
مؤشر
Volume
Support & Resistance
Compare up to 27 symbols across eight timeframes with seven analysis engines and an interactive cTrader dashboard.
مؤشر
Supertrend
Moving Average
Easy Trade: Trend & Breakout Indicator for cTrader
مؤشر
RSI
VWAP
+5
📈 Anchored VWAP with auto High/Low, session resets, Daily VWAP & TWAP — precise, Pine-accurate port.

السعر

7.56M
حجم التداول
22.21K
الربح بالبيب
271
التثبيتات المجانية