


Açıklama
Ne Yapar
MULTI-TIMEFRAME OHLC ve BIAS PANOSU, cTrader için çok zaman dilimli bir fiyat hareketi göstergesidir. Önceki gün, önceki hafta ve önceki ay OHLC seviyelerini — açılış, yüksek, düşük ve kapanış — grafiğinize çizer ve son iki tamamlanmış günde fiyatın bu seviyelerde gerçekte ne yaptığını okuyan bir pano ekler.
Önceki günün yüksek ve düşük seviyesi (PDH ve PDL), günlük açılış, haftalık yüksek ve düşük: bunlar çoğu gün içi ve salınım yatırımcısının zaten çalıştığı daha yüksek zaman dilimi destek ve direnç seviyeleridir. Genellikle her sabah gözle yaptıkları şey bunları karşılaştırmaktır — dün, ondan önceki günün üzerinde mi kapandı? Fiyat önceki günün yüksek seviyesini aştı mı ve başarısız mı oldu? Hareket gelişiyor mu yoksa alan mı tükeniyor? Bu gösterge bu soruları grafikte, tek bir satırda yanıtlar.
Çok zaman dilimli OHLC seviyeleri
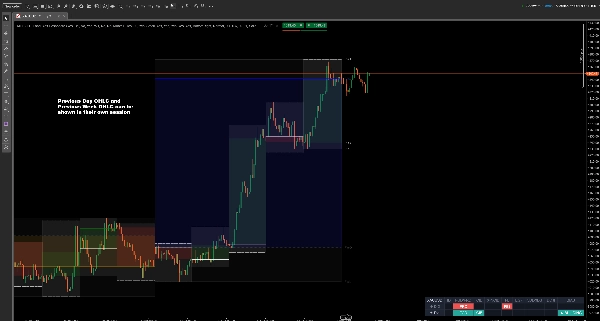
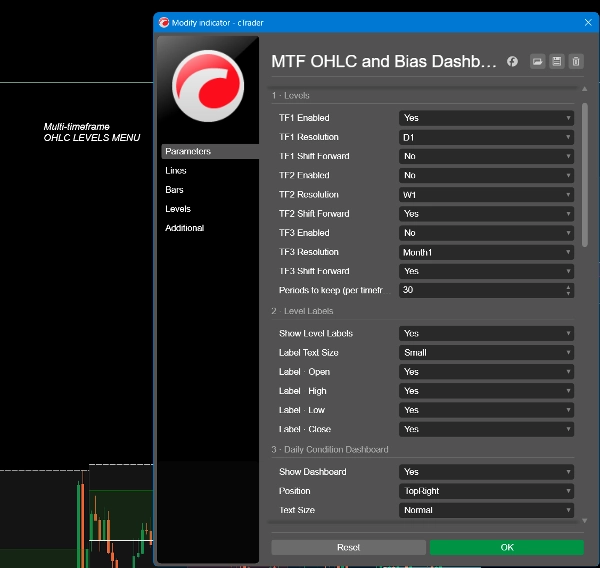
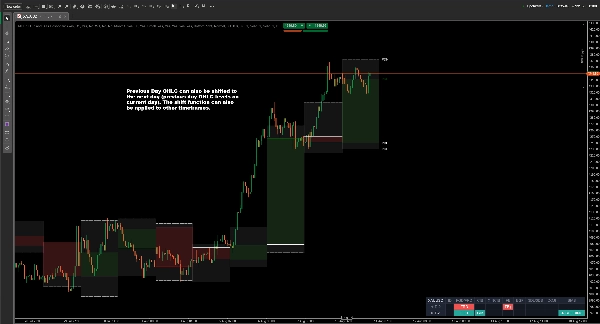
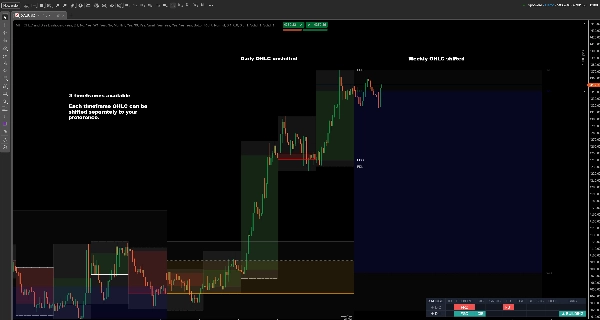
Aynı anda üç zaman dilimine kadar — günlük, haftalık, aylık veya seçtiğiniz herhangi bir çözünürlük. Her biri açılış, yüksek, düşük ve kapanışı çizer, isteğe bağlı gölgeli gövde ve yüksekten düşüğe bant ile. Seviyeler ileriye kaydırılabilir, böylece mevcut dönemin referansı fiyatın önünde oturur, arkasında değil, ve grafikte 70'e kadar tarihsel dönem tutabilirsiniz.
Her çizginin kendi rengi, kalınlığı ve stili vardır, böylece haftalık bir destek seviyesi asla günlük olanla karışmaz.
Günlük durum panosu
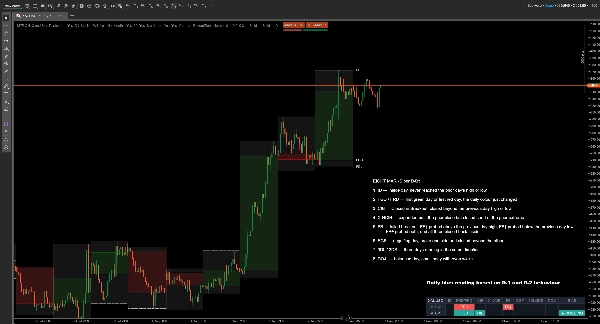
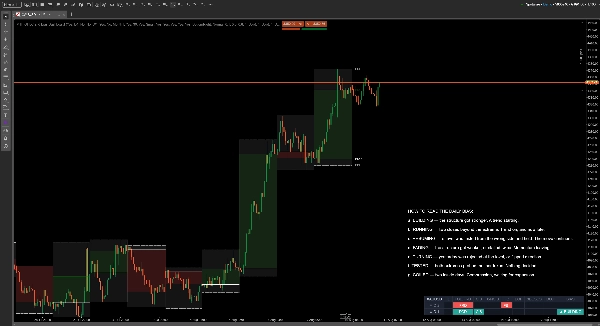
Pano, son iki tamamlanmış günlük mumları — D-1 (dün) ve D-2 (önceki gün) — her birini kendinden önceki günle karşılaştırarak değerlendirir.
Günde dokuz işaret:
- ID — iç gün, önceki günün yüksek veya düşük seviyesine hiç ulaşmadı
- FGD / FRD — ilk yeşil gün veya ilk kırmızı gün, günlük renk yeni değişti (Yeşil boğa günü, Kırmızı ayı günüdür)
- CIB — Kırılmada kapandı, önceki günün yüksek veya düşük seviyesinin ötesinde kapandı
- X-NCIB — önceki kapanışın ötesine genişledi ama önceki ekstremin altında kapandı (Expand Not Closed In Breakout = X-NCIB)
- FB — başarısız kırılma: FB↑ önceki günün yüksek seviyesinin üzerinde denedi, FB↓ önceki günün düşük seviyesinin altında denedi, FB± her ikisini de denedi ve üçü de tekrar içinde kapandı
- EGF — yutan gün, bir tarafı kırdı ve diğer tarafın ötesinde kapandı
- 3DL / 3DS — aynı yönde üç gün üst üste (3 Gün Uzun = 3DL / 3 Gün Kısa = 3DS)
- DOJI — dengeli gün, küçük gövde ve eşit fitiller
- BIAS — aşağıda açıklanan okuma
Günlük bias nasıl okunur
Bias, işi size kolaylaştıran kısımdır. Her gün tek bir duruma indirgenir ve bias, sadece dünden değil, D-2 ile D-1 arasındaki hareketten gelir. Aynı işaret, öncesinde ne olduğuna bağlı olarak farklı anlamlar taşır ve bu, tek günlük bir panonun size söyleyemeyeceği şeydir.
- GELİŞİYOR — yapı güçlendi. Bir trend başlıyor.
- DEVAM EDİYOR — ekstremin ötesinde iki kapanış. Trend devam ediyor ve artık geç kalındı.
- YENİDEN BAŞLIYOR — bir seviye yanlış taraftan test edildi ve tuttu. Hareket devam ediyor.
- ZAYIFLIYOR — yapı zayıfladı veya iki kez durakladı. Momentum azalıyor.
- DÖNÜYOR — dün seviyede reddedildi veya yön değiştirdi.
- TEST EDİLDİ — her iki ekstrem de denendi, hiçbiri alınmadı. Karar verilmedi.
- SIKIŞTI — iki iç gün. Sıkışma, genişleme bekleniyor.
Bir ok ve renk yönü taşır: boğa için yukarı yeşil, ayı için aşağı kırmızı, yön yoksa nötr gri.
Her iki detay satırı biasın üzerinde görünür kalır, böylece neden böyle okuduğunu her zaman görebilirsiniz, kara kutuya güvenmek yerine.
Tipik kullanım
Sabah grafiği açın, biası okuyun ve seans başlamadan önce devam mı, zayıflama mı yoksa aralık mı aradığınızı bilin. Sonra çizilen seviyelere karşı kendi kurulumlarınızı işlem yapın — önceki günün yüksek ve düşük seviyeleri, günlük açılış, haftalık ekstremeler.
Açılış aralığı çalışmaları, başarısız kırılma ticareti ve günlük devam stratejileri için uygundur. Forex, endeksler, metaller ve kripto para genelinde kullanışlıdır.
Ayarlar
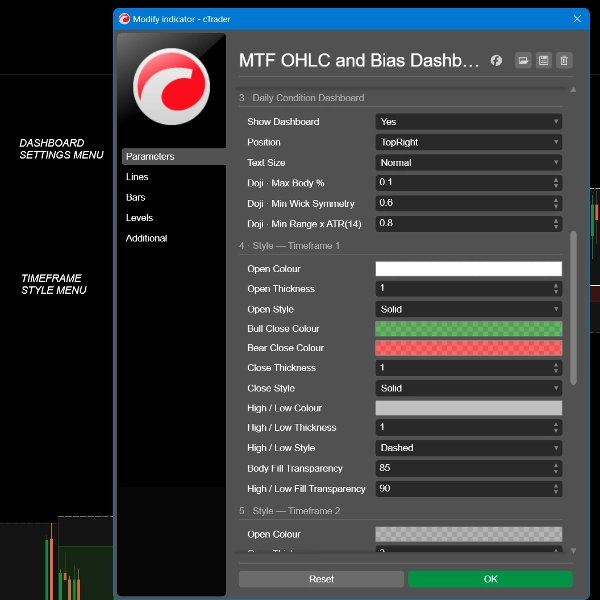
- Her biri kendi çözünürlüğü, ileri kaydırma seçeneği ve tam renk, kalınlık ve stil kontrollerine sahip üç bağımsız zaman dilimi yuvası
- Grafikte tutulacak tarihsel dönem sayısı, 70'e kadar
- Çizgi türüne göre seviye etiketleri açık veya kapalı, ayarlanabilir metin boyutu ile
- Pano açık veya kapalı, beş ekran pozisyonu, dört metin boyutu
- Doji hassasiyeti: maksimum gövde yüzdesi, minimum fitil simetrisi, 14 günlük ortalamaya göre minimum aralık
******************************************************
Kimin için
Önceki gün ve önceki hafta seviyelerinden zaten çalışan gün içi ve salınım yatırımcıları için. Önceki günün yüksek seviyesinin ne olduğunu ve neden önemli olduğunu bildiğinizi varsayar. Bu seviyeler zaten ticaretinizin bir parçası değilse, bunu kullanmayı size öğretmez.
Ne yapmaz
Bunu şimdi netleştirmek ikimiz için de sonra zaman kazandırır:
- Alım veya satım sinyalleri vermez, giriş veya çıkış fiyatları vermez
- Emir vermez ve hesabınıza dokunamaz — gösterge hiçbir erişim hakkı olmadan çalışır
- Uyarı veya bildirim yoktur
- Hiçbir şey tahmin etmez. Her işaret zaten kapanmış mumları tanımlar
- Yeniden boyamaz. Pano sadece tamamlanmış günlük mumları okur, bu yüzden bir okuma sonradan değişmez
- Bir strateji değildir. Bias yapıyı tanımlar; işlem önermez
********************************************************
Bilmeniz Gerekenler
Pano en az dört tamamlanmış günlük muma ihtiyaç duyar, bu yüzden yeni listelenen bir sembol yeterli geçmişe sahip olana kadar çizgiler gösterir.
Günlük mumlar brokerınızın sunucu saatinde başlar. Aynı enstrümanda iki broker günü farklı saatlerde kesebilir, bu da aynı sembolün iki platformda meşru olarak farklı okunabileceği anlamına gelir. Bu veri özelliğidir, göstergede bir hata değildir.
Günlük zaman diliminin üstünde pano günlük veriyi okuyamaz ve TF > D uyarısı gösterir. Seviyeler yine de çizilir.
Ticaret risk içerir. Geçmiş performans gelecekteki sonuçları garanti etmez.
Özet
A central feature is the two-day price action bias dashboard, which analyzes the last two completed daily candles relative to their preceding days. It categorizes daily price behavior into nine distinct patterns (e.g., inside day, first green/red day, failed breakout, engulfing day) and summarizes the overall bias into states such as building, running, fading, or turning. Directional bias is indicated with colored arrows (green for bullish, red for bearish, grey for neutral), helping traders quickly assess market structure without guesswork.
Designed for intraday and swing traders familiar with previous day and week levels, the indicator does not provide trade signals, alerts, or order execution. It is suitable for forex, indices, metals, and cryptocurrencies, aiding strategies like opening-range, failed-breakout, and continuation trading by clearly marking key levels and daily price action context.
Tartışma
Müşteri değerlendirmeleri
SSS
Bu oluşturanın diğer ürünleri




















Fiyat